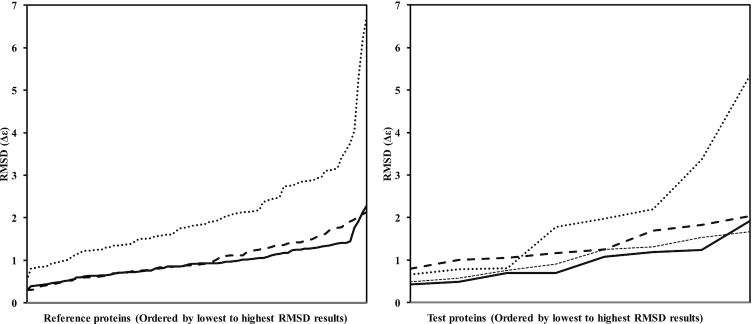
Figure 1.
Plots of the RMSD values between calculated spectra for DichroCalc (dotted line), PDB2CD (thick dashed line), SESCA (right hand panel thin dashed line) and PDBMD2CD (solid line) for the Reference proteins in the leave-one-out cross-validation, (left hand panel) and for the test proteins (right hand panel).

