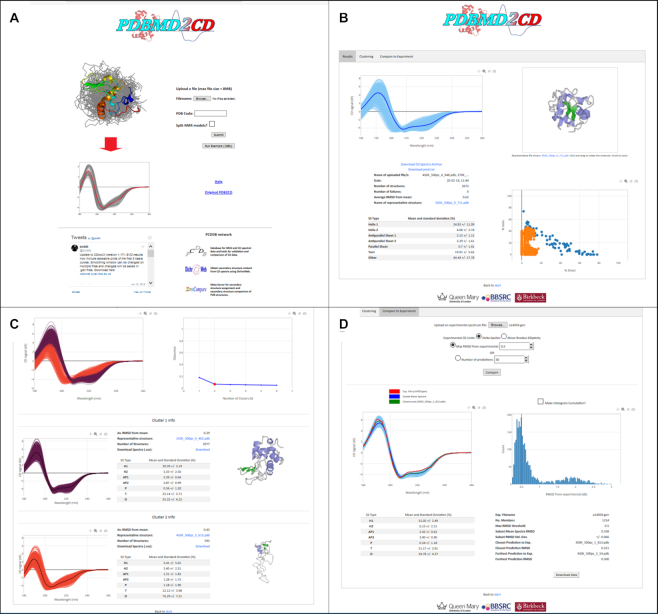
Figure 3.
Example pages from the PDBMD2CD web server. Panel (A) is the landing input page; panel (B) the ‘Results’ page showing all the predicted spectra (in light blue in the left pane together with the most representative spectrum of the set in dark blue), the most representative structure of the set (in the right upper pane), the secondary structure alpha helix versus beta sheet content in the right hand lower pane, the blue being for the reference set, the orange for the input structures (2672 here) and associated secondary structure information (in the lower left pane); panel (C) is the ‘Clustering’ page illustrating the results from a k-mean = 2 clustering (shown in the right hand pane), where, below this, the spectra have been clustered into the purple first cluster set, and the dark orange second cluster set, and there are associated secondary structure information and the most representative structures associated with each cluster also shown in the panes to the right of the plots; Panel (D) is the ‘Compare to Experiment’ page and shows the information obtainable from comparison to an input experimental spectrum. Here a subset of spectra is being shown with an RMSD smaller or equal to 0.5 as maximum away from the experimental spectrum. The spectra are shown in the left pane in light blue, with the experimental spectrum in red, the subset mean in dark blue and the closest spectrum to the experimental in green. A histogram plot showing the RMSD distribution of predicted spectra distanced from the experimental spectrum is shown in the right hand pane with a red line indicating the RMSD/number of chosen spectra in the current subset. Below this are secondary structure and associated data pertinent to the current chosen subset.

