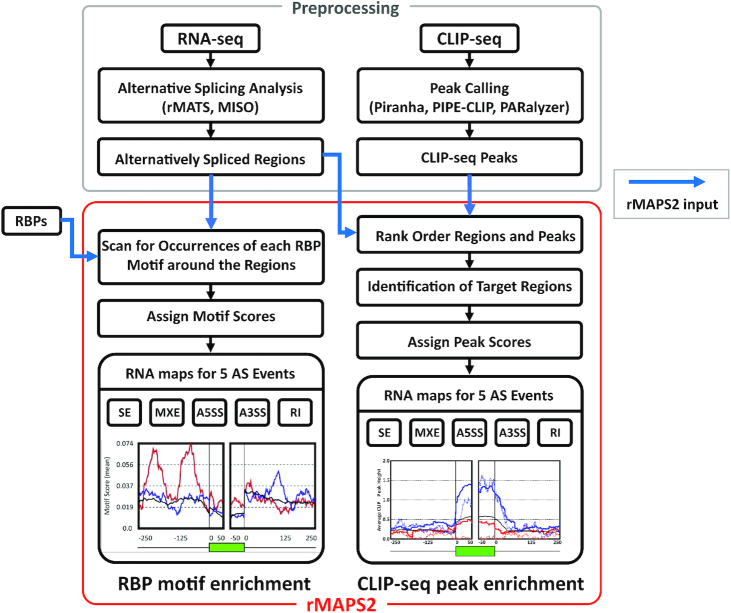
Figure 1.
The overall workflow of rMAPS2. The RBP motif analysis takes the AS analysis results from RNA-seq data, then scans for the occurrences of the known RBP motifs around the differentially regulated AS regions to generate an RNA map for each RBP. Similarly, the CLIP-seq binding site analysis generates an RNA map using the signals of CLIP-seq binding sites around the differentially regulated AS regions. Blue arrows indicate rMAPS2 input files.

