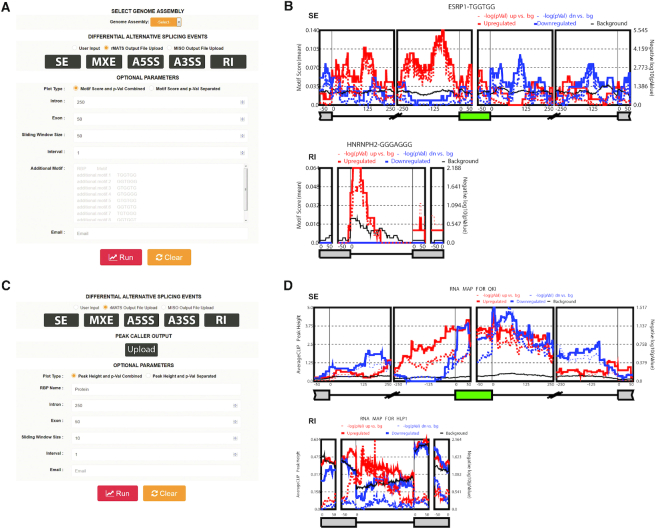
Figure 2.
A view of rMAPS2 input and output pages. (A) Input page for the RBP motif analysis tool. After providing all required inputs, clicking on the ‘Run’ button will start the analysis. (B) An example output page of the motif analysis tool for SE and RI events (see Supplementary Figure S2 for the A5/3SS and MXE cases). It generates RNA maps for known RBP motifs for each AS type along with a URL link for the entire results for future use. (C) Input page for the CLIP-seq binding site analysis tool. It requires AS events from RNA-seq data and peaks from CLIP-seq data. (D) An example output page of the CLIP-seq binding site analysis tool for SE and RI events (see Supplementary Figure S3 for the A5/3SS and MXE cases). The RI case is generated from Arabidopsis thaliana datasets to illustrate the importance of RI events in plants. It generates an RNA map for the RBP of interest for each AS type and a URL link for the entire results for future use.

