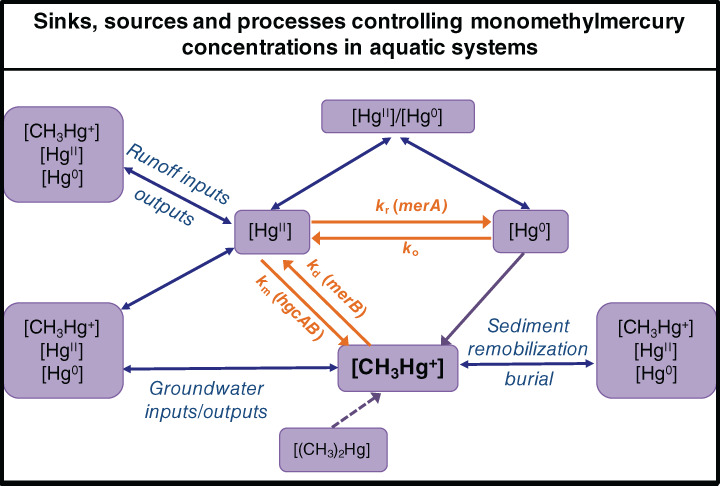
Figure 3.

Proposed model to quantify MMHg in freshwater systems. The model considers formation (k m, HgII methylation) and degradation (k d, MMHg demethylation) and the inputs and outputs of MMHg. Processes are represented with orange arrows, known functional genes are shown in brackets. Transport of MMHg to the system or out the system is represented by blue arrows.
