
Figure 4.
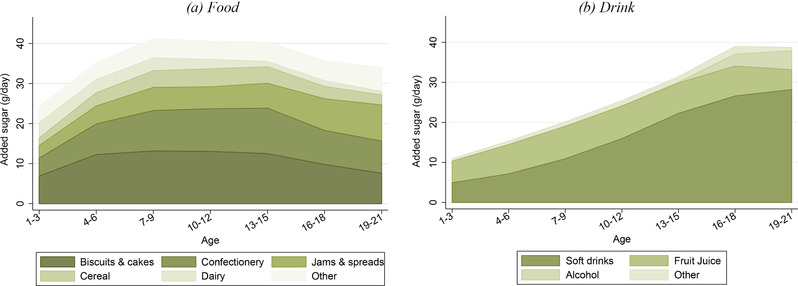
Added sugar consumption by type of food and drink and by age
Note: The graphs show the average amount of added sugar (grams per day) that individuals within each three‐year age band obtain from each food group (left‐hand panel) and each drink group (right‐hand panel). Data are from the NDNS; sample comprises 6,112 individuals aged 1–21 over 2008–16. Groups are ordered (from bottom to top) in terms of the average amount of added sugar that individuals under 22 years old get from that food or drink group (with the exception of ‘other’, which is placed at the top). ‘Other’ food includes (in order of average contribution to added sugar consumption) fruit and vegetables, miscellaneous, sauces, pasta and rice, meat and fish, toddler food, bread, eggs, crisps and potatoes. ‘Other’ drinks include (in order of average contribution to added sugar consumption) milk and hot beverages. See Appendix A online for more details on the data, including food group definitions.