
Figure 6.
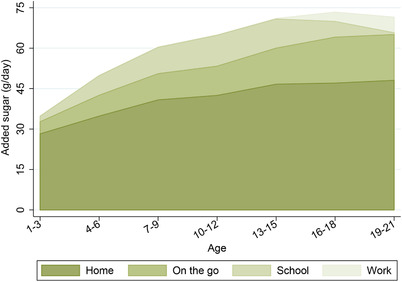
Added sugar consumption by location and age
Note: The graph shows the average amount of added sugar (grams per day) that individuals consume at home, on the go, at school or at work, as recorded in the NDNS. Sample is 6,112 individuals aged 1–21 over 2008–16. Locations are ordered (from bottom to top) in terms of the average amount of added sugar individuals under 22 years old consume in that location. See Appendix A online for more details on the data.