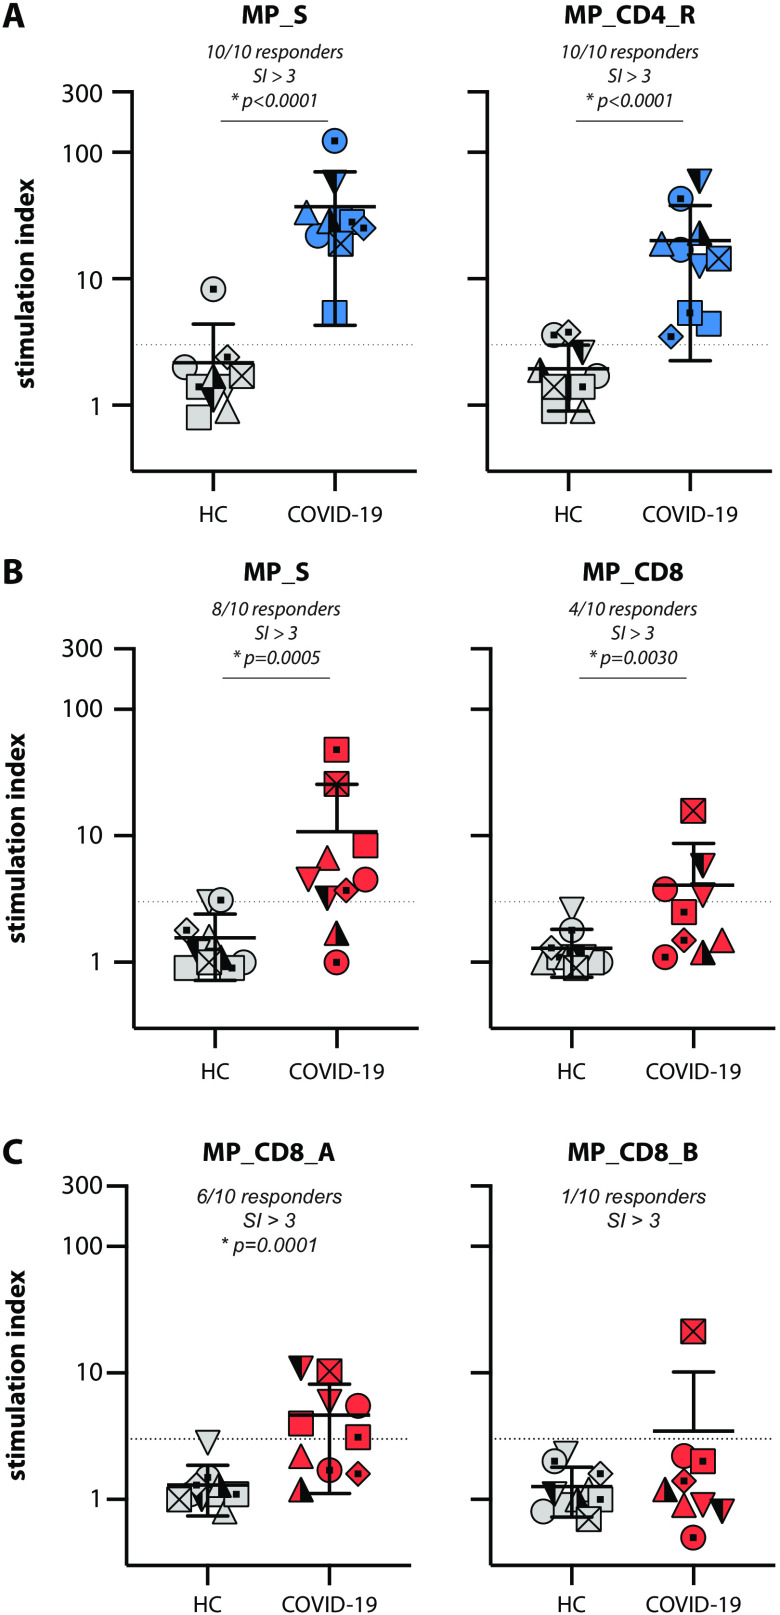
Fig. 4. Stimulation index identifies specific responders.
Antigen-specific activation of CD4+ (A) and CD8+ T cells (B,C) in COVID-19 patients after stimulation for 20 hours with peptide MegaPools (MP) shown as stimulation index (SI). Stimulation index is derived by dividing the percentage obtained with specific stimulation (MP) by the percentage obtained with the vehicle control (DMSO). Values for respective stimulations are shown in Fig. 2 (CD4+, color coded in blue) and Fig. 3 (CD8+, color coded in red). Donors with a SI > 3 (dotted line) are regarded as responders to MP stimulation. Panels show individual values for n=10 patients vs. n=10 HC, as well as the mean ± SD. Asterisk denotes a significant difference. HC = healthy control. Symbol shapes of COVID-19 patients are identical between panels, and refer back to Fig. 1.

