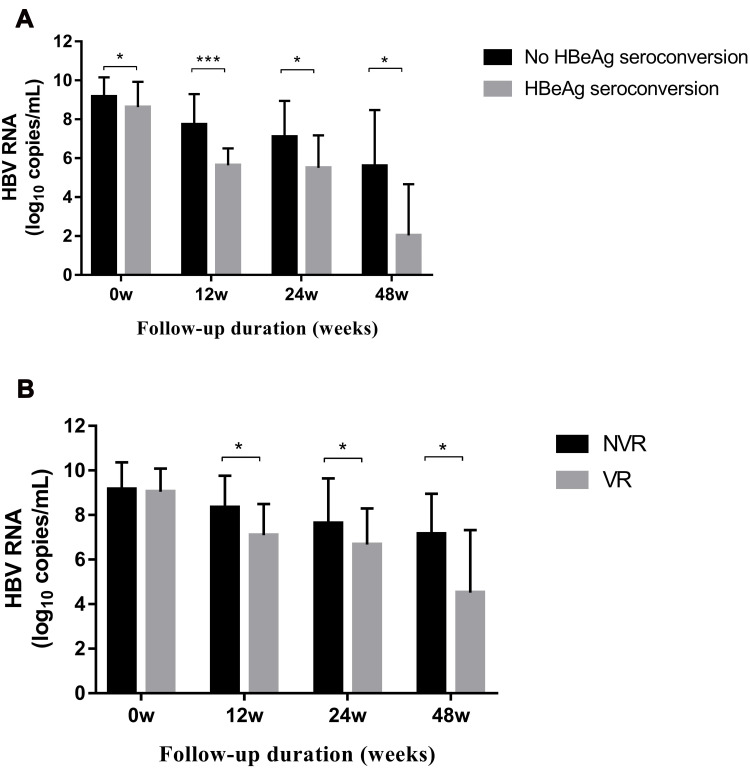
Figure 1.
Serum level of HBV RNA at indicated time points: (A) Comparison of the serum HBV RNA level between the HBeAg-seroconversion group and non-HBeAg-seroconversion group. (B) Comparison of the serum HBV RNA level between the virologic response (VR) group and non-virologic response (NVR) group. Data are the mean ± SEM, and determined by the Mann–Whitney U-test. *p < 0.05, ***p < 0.001.

