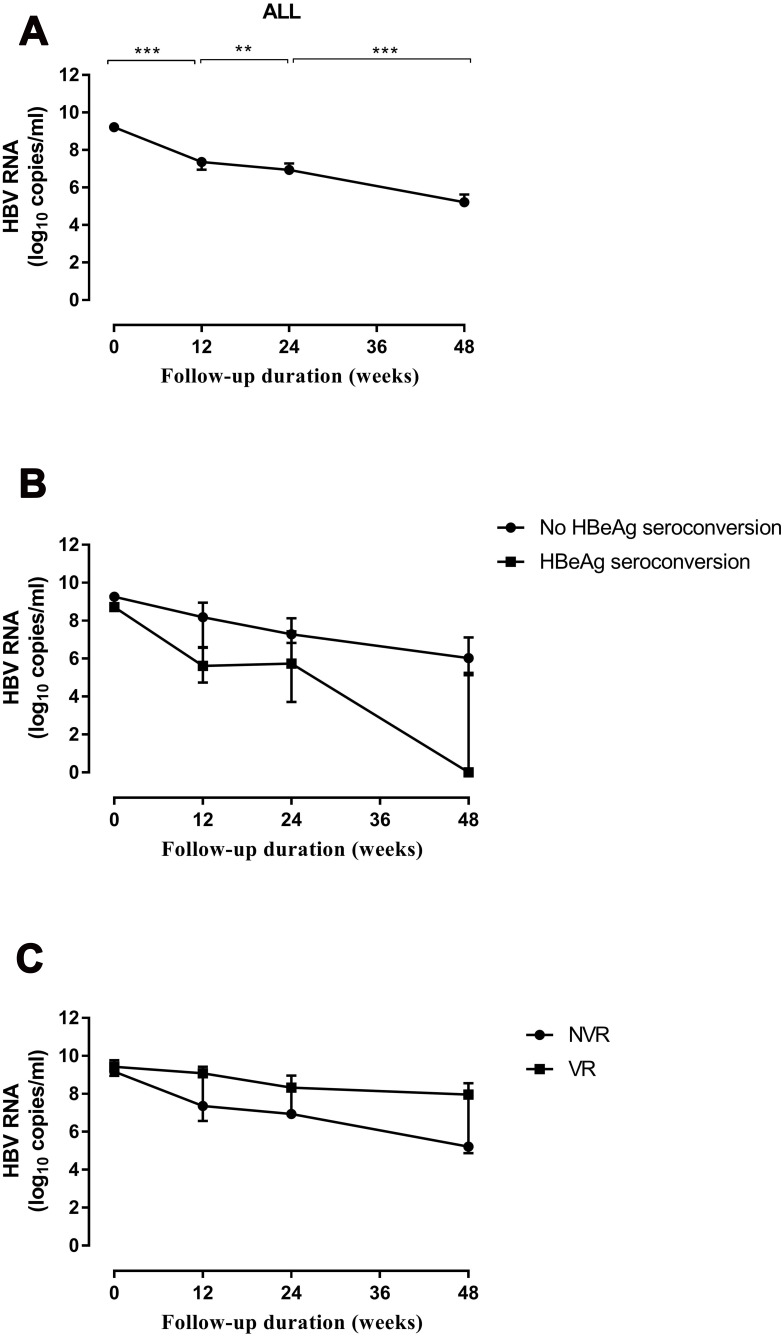
Figure 4.
Dynamic changes in the HBV RNA level during NA therapy. (A) Trend in the total RNA level. (B) Grouping was based on whether HBeAg seroconversion occurred at week 96. (C) Grouping was based on whether a VR occurred at week 96. Data are the median value, and determined by the Mann–Whitney U-test. **p < 0.01, ***p < 0.001.

