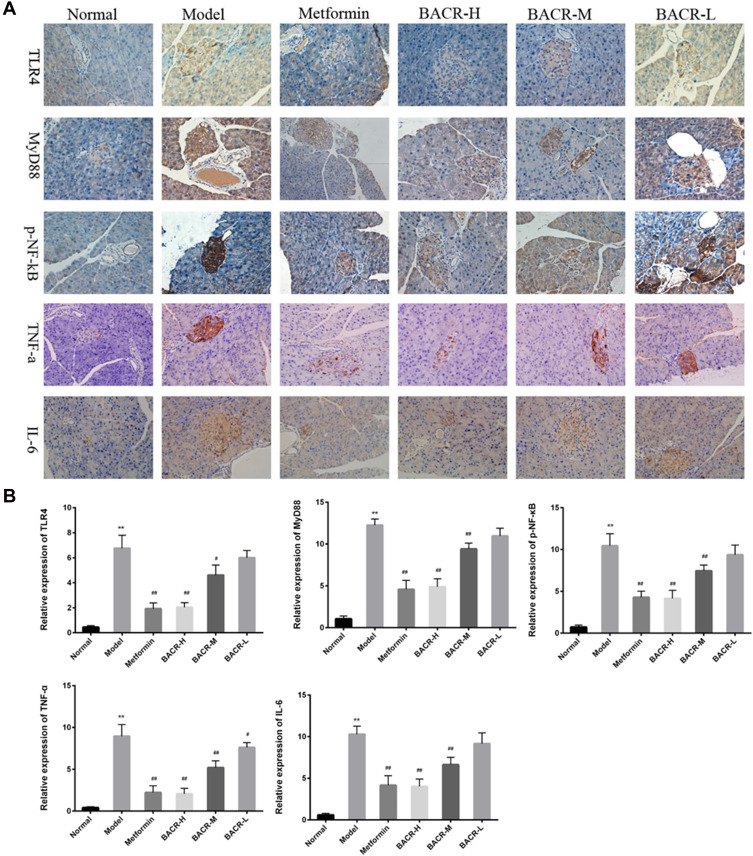
Figure 7.
Immunohistochemical (IHC) staining (400×) showed expression of TLR4, MyD88, p-NF-κB, TNF-α, and IL-6 in pancreas tissues. The positive rate was analyzed with Image-Pro Plus. Metformin group: 320mg/kg; BACR-H group: 120mg/kg; BACR–M group: 60mg/kg; BACR-Lgroup: 30mg/kg. Data are presented as the mean ± SD (n = 10). **P< 0.01 vs Normal control group. #P < 0.05 or ##P<0.01 vs Model control group.

