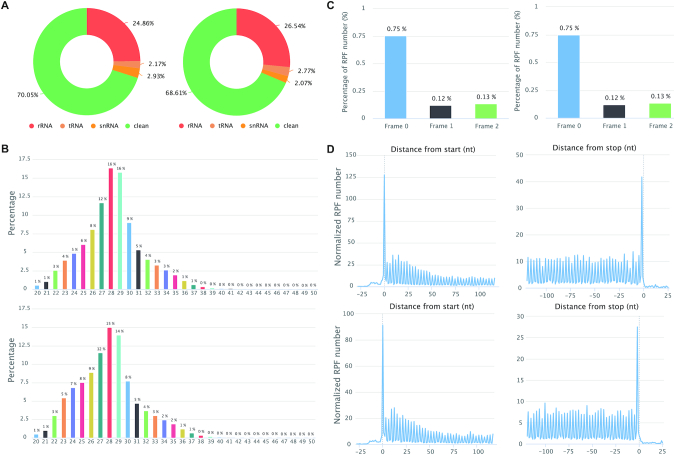
Figure 4.
RiboToolkit quality control outputs for Ribo-seq data of Mettl1 knockout and control mESCs. (A) RPF mapping statistics (rRNA, tRNA, snRNA and clean sequences). (B) RPF length distribution. (C) RPF frame distribution. Y-axis indicates the percentage of RPFs in each coding frame while x-axis represents different coding frames (frame 0, frame 1, and frame 2). (D) global 3-nt periodicity checking using metagene distribution plot.

