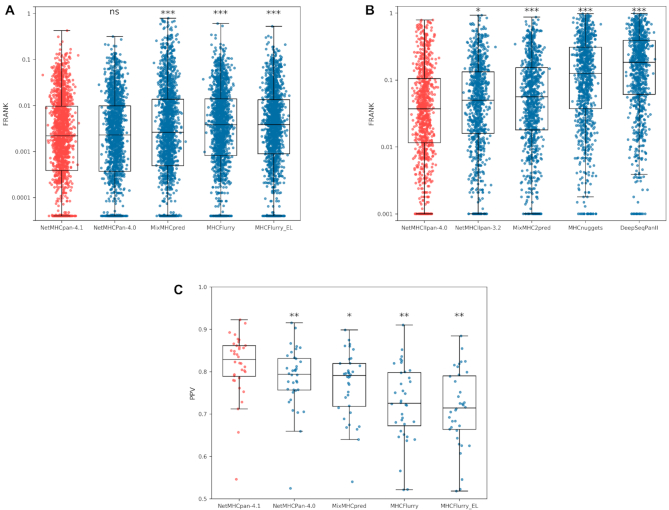
Figure 2.
Epitope benchmark results for the NetMHCpan-4.1 and NetMHCIIpan-4.0 web servers. (A) Performance results for the CD8+ epitope benchmark. Median FRANK values for the different methods are: NetMHCpan-4.1, 0.00220; NetMHCpan-4.0, 0.00230; MixMHCpred, 0.00264; MHCFlurry, 0.00383; and MHCFlurry_EL, 0.00386. (B) FRANK performance results for the CD4+ epitope benchmark. The median FRANK for the different methods are: NetMHCIIpan-4.0, 0.0351; NetMHCIIpan-3.2, 0.04825; MixMH2Cpred, 0.0513; MHCnuggets, 0.1219; and DeepSeqPanII, 0.1767. (C) PPV performance results for the MS MHC class I eluted ligand benchmark. Median PPV values for the different methods are: NetMHCpan-4.1, 0.8291; NetMHCpan-4.0, 0.7940; MixMHCpred, 0.7911; MHCFlurry, 0.7256; and MHCFlurry_EL, 0.7144. P-values are shown as * P < 0.05, ** P < 10−6 and *** P < 10−9. All p-values were calculatated using a two-tailed binomial test. The plotted boxes extend from the lower to upper quartile values of the data (25th to 75th percentile), with a line at the median; whiskers extend from the box to show the range of the data to the most extreme, non-outlier data points.

