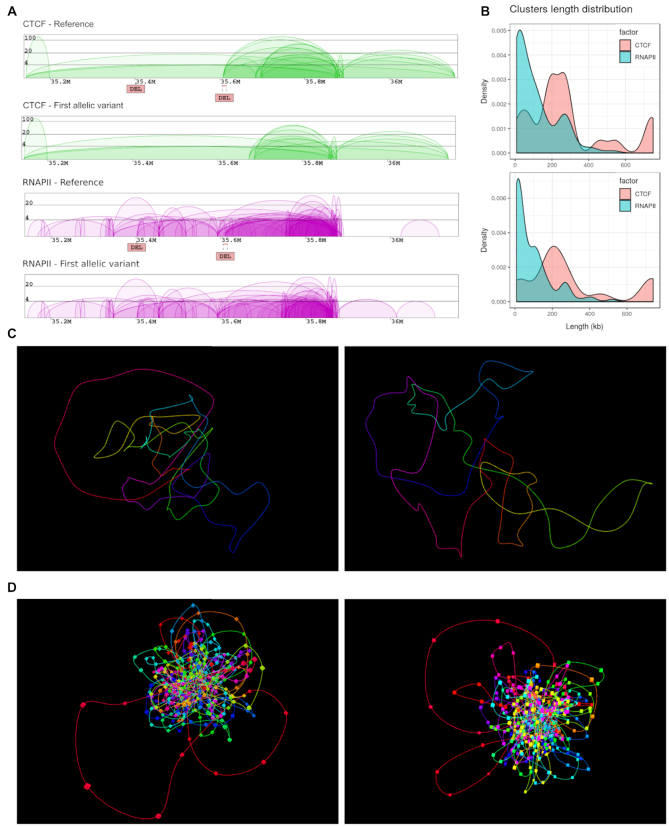
Figure 3.
Output of 3D-GNOME 2.0. for an exemplary region (chr14:35138000-36160000) affected by two deletions: (chr14:35401403-35401724 and chr14:35605439-35615196). (A) Screenshot of the result page with diagrams of chromatin contacts mediated by CTCF (green) and RNAPII (purple) for both the reference genome (based on GM12878 data) and the variant genome (based on SVs from HG00099); the deletion chr14:35605439-35615196 (right DEL) disrupts CTCF and RNAPII interactions. (B) Clusters length distribution for CTCF and RNAPII protein factors for reference genome (top) and HG00099 (bottom). (C, D) Representation of 3D models in the 3D viewer, proposed using only CTCF interactions (panel C) or both CTCF and RNAPII data (panel D) from the reference genome (left) and that affected by SVs (right).

