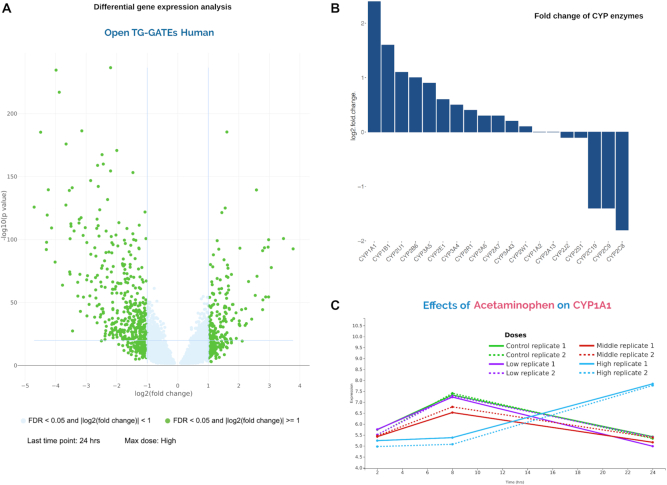
Figure 2.
Query for ‘acetaminophen’. (A) Volcano plot displays differentially expressed genes for acetaminophen where significant genes are highlighted in green in TGH. (B) Bar plot shows a log2-fold-change in CYP 450 genes for acetaminophen. (C) The line plot shows the effect of time and dose of acetaminophen on CYP1A1 in TGH.

