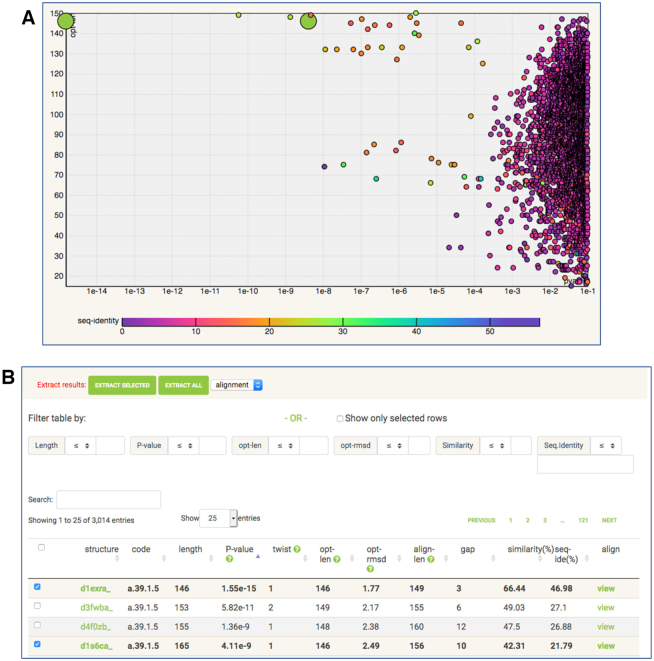
Figure 2.
Interactive output of structure similarity search. The SCOP database clustered at 40% sequence identity was queried by the structure of troponin C (PDB entry: 1tcf chain A). (A) The scatter plot of PDB ‘hits’ identified in the search. X-axis: FATCAT P-value in logarithmic scale. Y-axis: length of the alignment. (B) The top of the list of PDB ‘hits’ with options for searching, sorting and filtering. The selection of results can be made on the scatter plot or on the list of results.

