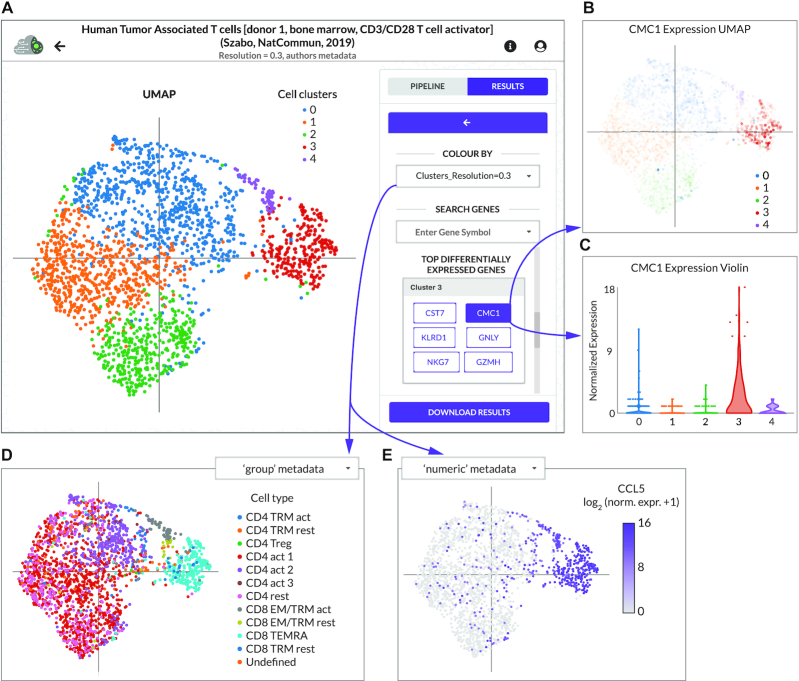
Figure 2.
CReSCENT’s web portal visualizations menu. (A) Control menu of a CReSCENT project called Human Tumour-Associated T cells, showing a UMAP with the five cell clusters detected by the CReSCENT pipeline. The right-hand menu allows the user to switch between plot types (UMAP, t-SNE or violin) and between the type of data to be plotted (e.g. cell clusters, DEG’s expression or metadata). (B) UMAP of CMC1, which is a DEG from cluster 3. Each dot denotes an individual cell and the opacity of the dot corresponds to the expression of CMC1 in that cell. (C) Violin plot representation of CMC1 expression across the five cell clusters detected by CReSCENT shows higher expression of the gene in cluster 3. (D) UMAP coordinates obtained by CReSCENT’s pipeline are used to show cell metadata provided by the user for cell types (‘group’ discrete categories). (E) Similar to D but showing other types of metadata provided by the user for expression of gene CCL5 measured by an orthogonal method with ‘numeric’ continuous values.

