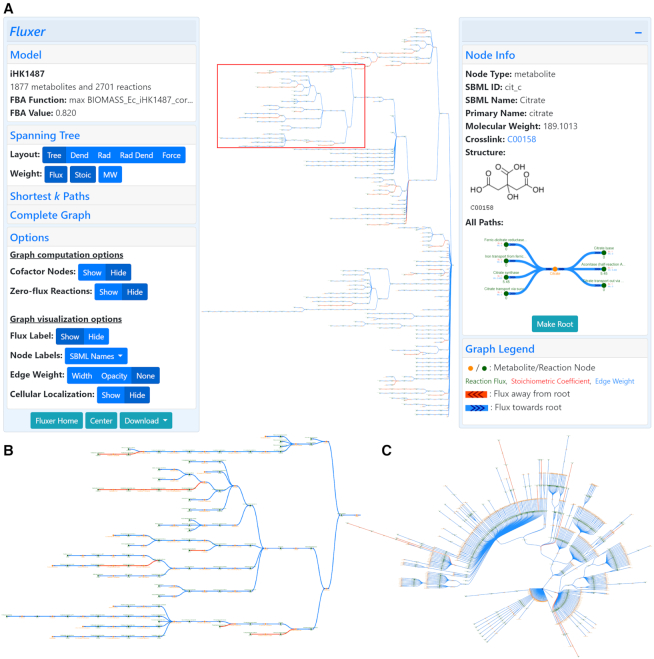
Figure 1.
Fluxer interface showing a spanning tree visualization of a genome-scale metabolic model of Escherichia coli BL21 (DE3) rooted in the cell biomass reaction. (A) The interactive web application can display the complete metabolic network with clear layouts computed in base of the optimized metabolic fluxes. The left card shows general information about the model and gives access to different visualization options. The right card shows details about the selected metabolite or reaction. (B) Zoomed view of one of the branches in the metabolic flux tree (red box). (C) Radial visualization of the flux tree including cofactor metabolites. Green nodes represent reactions and yellow nodes represent metabolites. The reaction flux is displayed below each reaction node. Arrow heads indicate direction of fluxes going toward (blue edges) or coming from (red edges) the reaction or metabolite selected as the root of the spanning tree.

