
Figure 3.
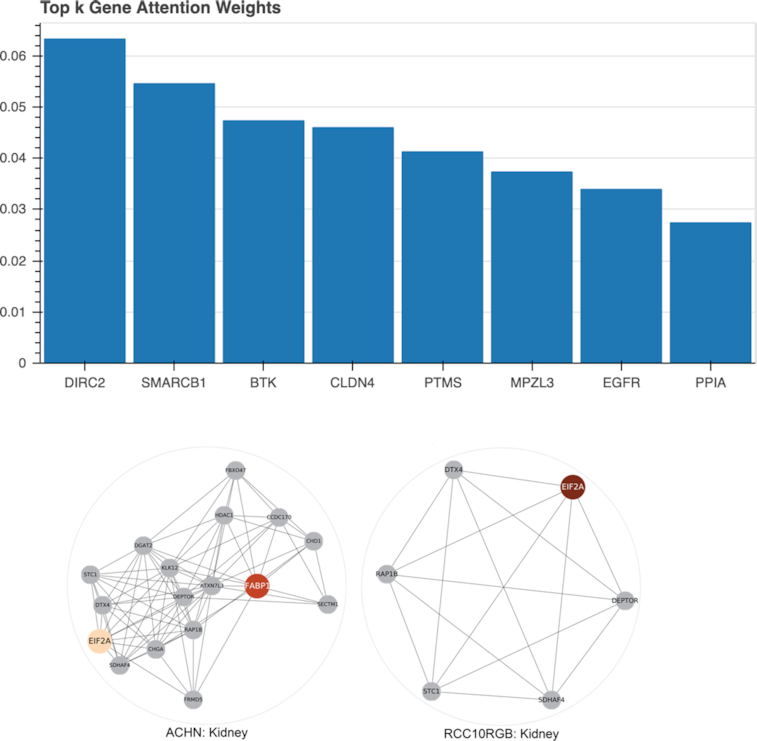
Visualized gene attention weights. Top: The averaged gene attention weights across all cell lines from the panel using the interactive visualization available in the web service. Bottom: Gene attention weights for two kidney cancer cell lines, ACHN (left) and RCC10RGB (right), are displayed using an orange color map. The colored genes received highest attention weights and are displayed with neighboring genes according to the STRING network. This network visualization is not available in the web service.