
Figure 2.
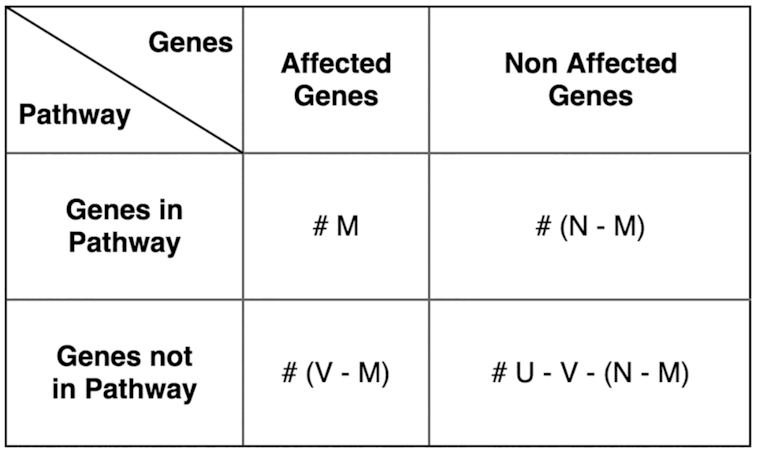
Contingency table for enrichment analysis. N = Number of affected genes; M (≤N) = affected genes in the pathway; V = number of genes in the Reactome pathway; U = number of genes in the Reactome universe.
Official websites use .gov
A
.gov website belongs to an official
government organization in the United States.
Secure .gov websites use HTTPS
A lock (
) or https:// means you've safely
connected to the .gov website. Share sensitive
information only on official, secure websites.
Contingency table for enrichment analysis. N = Number of affected genes; M (≤N) = affected genes in the pathway; V = number of genes in the Reactome pathway; U = number of genes in the Reactome universe.