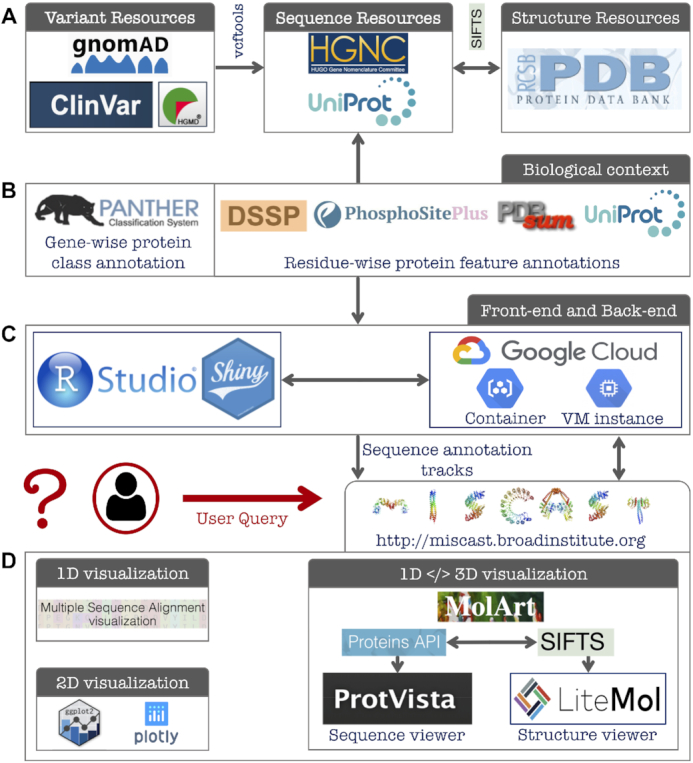
Figure 1.

MISCAST architecture, main modules, and data flow. (A) Online resources used for collecting missense variants, gene symbols, protein sequences and structures. (B) Databases searched to aggregate gene- and residue-wise biological context annotations. (C) MISCAST development using Shiny R package and deployment using Google Cloud services. (D) Three main visualization schemes of MISCAST. Missense variants and protein features are displayed in 1D, 2D and concurrent 1D </> 3D views.
