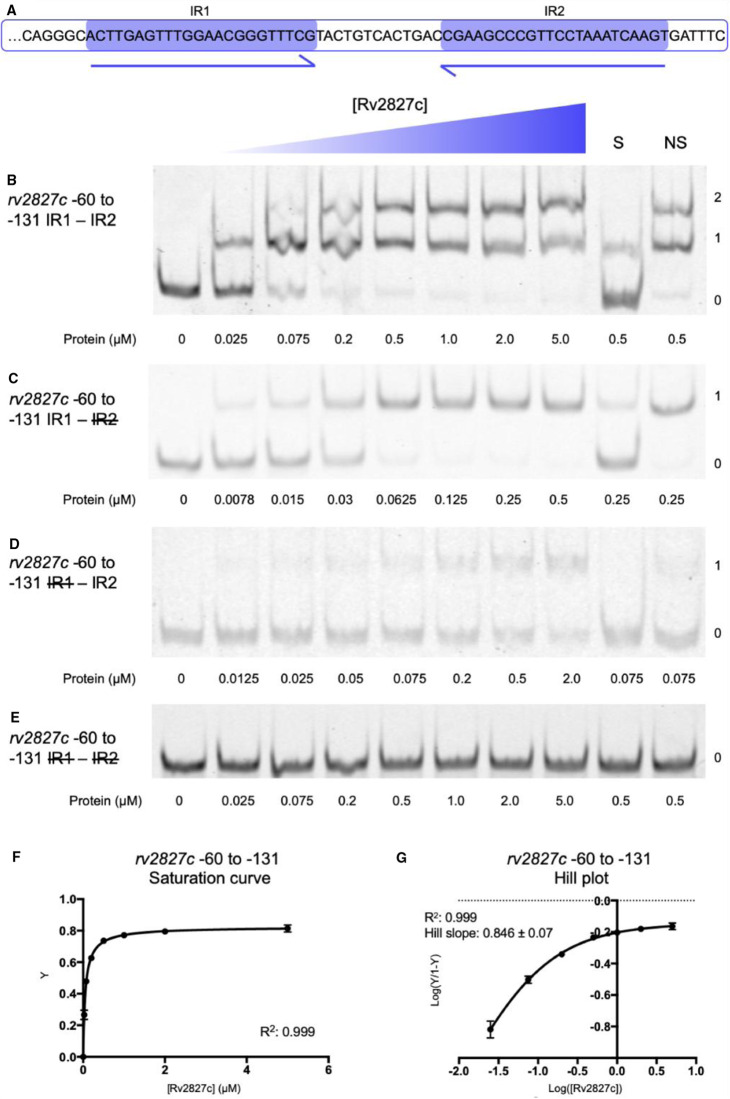
Figure 5. Rv2827c binds with weak negative co-operativity to the IR1–IR2 region of the rv2827c–rv2826c promoter.
(A) Sequence level cartoon of the fluorescently labeled probe containing IR1–IR2. (B) Electrophoretic mobility shift assay (EMSA) of titrated Rv2827c with the probe in (A). (C) EMSA of titrated Rv2827c with the probe in (A) altered by replacing IR2 with polyC. (D) EMSA of titrated Rv2827c with the probe in (A) altered by replacing IR1 with polyC. (E) EMSA of titrated Rv2827c with the probe in (A) altered by replacing both IR1 and IR2 with polyC. For (B–E); protein concentrations are shown on each panel together with the binding events (0, 1 or 2); S — each experiment contained 100-fold excess of the specific unlabeled probe; NS — each experiment contained 100-fold excess of non-specific unlabeled probe; numbering −60 to −131 denotes the promoter region included in the probe. (F) Fractional saturation curve plotted using the EMSA data of (B). (G) Hill plot using the EMSA data from (B). For (F) and (G), points are plotted from triplicate data and display mean values with standard error of the mean.

