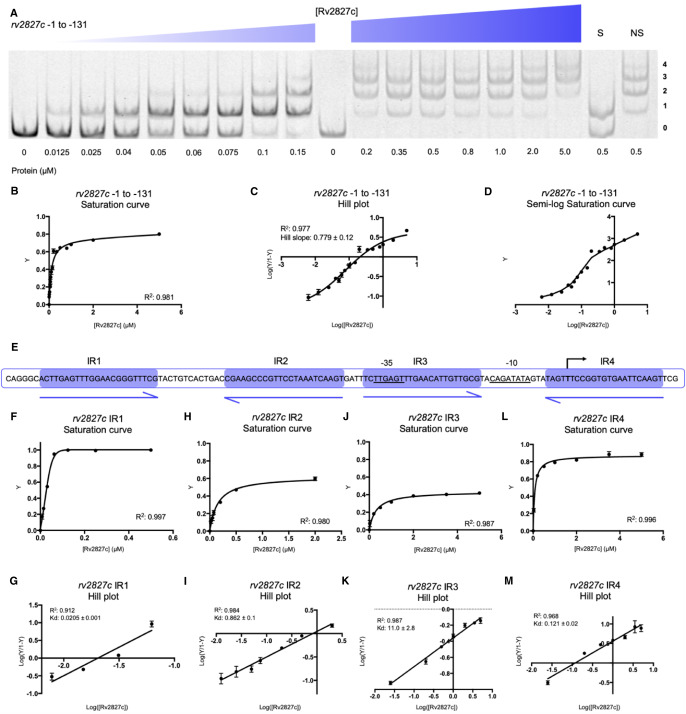
Figure 6. Rv2827c binds with negative co-operativity to the full rv2827c–rv2826c promoter.
(A) EMSA of titrated Rv2827c with a probe covering from −1 to −131 of the rv2827c–rv2826c promoter, covering IR1 to IR4. The titration was performed across two EMSA gels, with an additional zero protein lane included in the second gel for normalization. Protein concentrations are shown below each gel together with the binding events (0, 1, 2, 3 or 4); S — each experiment contained 100-fold excess of the specific unlabeled probe; NS — each experiment contained 100-fold excess of non-specific unlabeled probe. (B) Fractional saturation curve plotted using the EMSA data of (A). (C) Hill plot using the EMSA data from (A). (D) Semi-log saturation curve plotted using the EMSA data of (A), showing distinct breaks in the binding curve, in accordance with the multiple binding sites contained in the probe. (E) Sequence level cartoon of the fluorescently labeled probe containing rv2827c–rv2826c −1 to −131. (F–M) Saturation curves (F,H,J,L) and Hill plots (G,I,K,M) for each IR calculated using individual IR data gathered using mutant probes (Figures 4C, D and 5C,D). For (B–D) and (F–M), points are plotted from triplicate data and display mean values with standard error of the mean.

