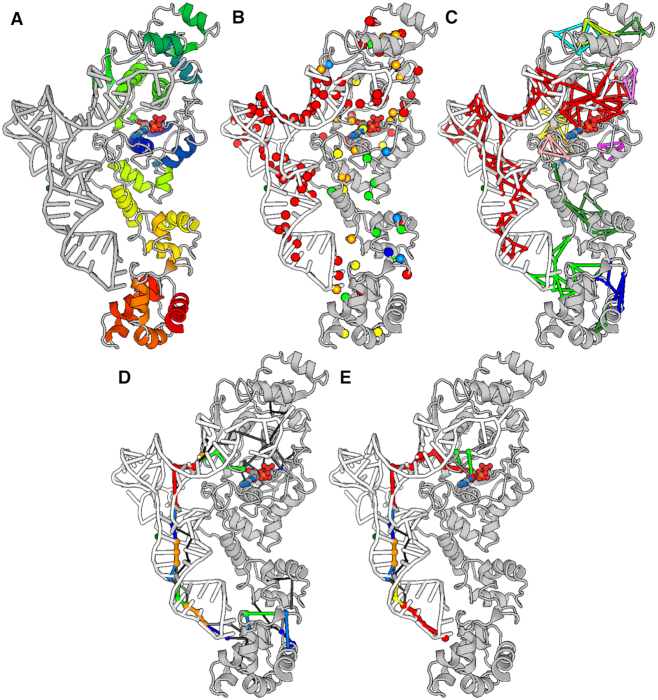
Figure 4.
Structural communication in a protein-nucleic acid complex. Snapshots of the 3D output visualization are shown. They concern single PSN calculation on a productive ternary complex between ATP-bound GluRS and tRNA. (A) All residues included in calculation of the PSG and the shortest communication pathways are shown. The image of the GluRS-ATP-tRNA complex is a snapshot of the webserver input page, where the graphical representation (i.e. cartoons for the protein and the nucleic acid and ball-and-sticks for ATP) and coloring are the viewer defaults. (B) Hubs are shown as spheres centered on the Cα-atoms and colored according to the average interaction strength of their links. A color legend is available on the webserver. (C) The nodes and link communities are shown, colored according to their size, with red indicating the biggest community. (D) The global metapath is shown, with color indicating link recurrence. A color legend is available on the webserver. (E) The displayed metapath was inferred from the subset of pathways holding the anticodon C34 and ATP as well as all residues within a sphere of 3-Å radius (from the centroids of the selected residues) as extremities (i.e. following an interactive path filtering). All images in panels B-E are snapshots of the webserver output page, where GluRS is gray, tRNA is white, and ATP is colored by atom type.

