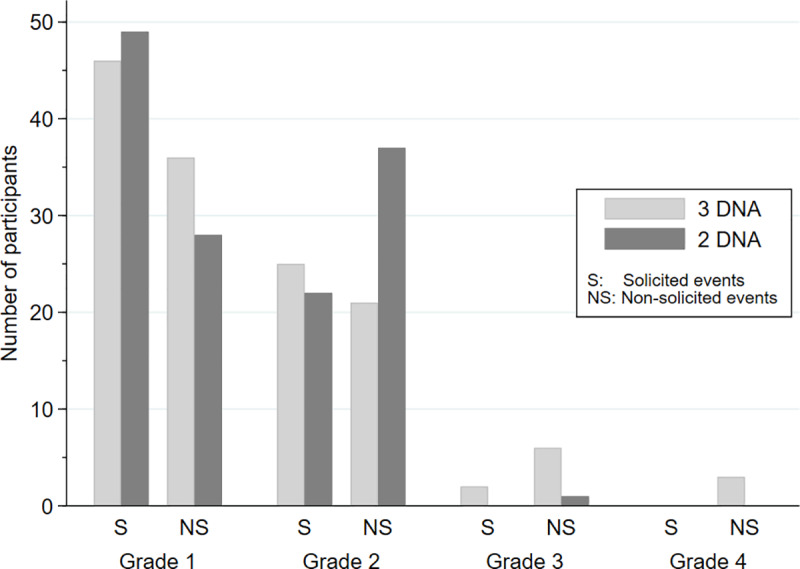
Fig 2. Frequencies of participants with solicited and non-solicited events per vaccine groups, EV03/ANRS VAC20 Phase I/II Trial.

The maximum grade is shown per participant and event category. Differences between groups: p = 0.32 and p = 0.56 for solicited and non-solicited events, respectively (rank tests).
