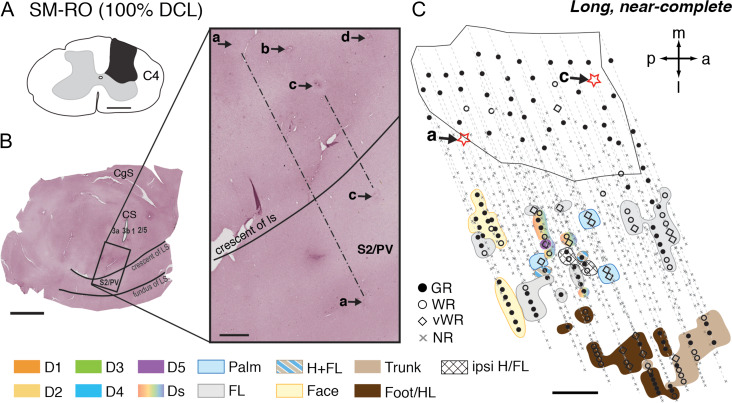
Figure 5.
Representative case for Group 4. Alignment of the somatotopic map of areas S2/PV and brain sections stained for CTB in monkey SM-RO after a long-term, complete DCL (100% complete; 253 days) at the C4 level. A. Drawing shows the reconstructed transverse view of DCL in the spinal cord. B. Photomicrographs of a flattened cortical section immunoreacted for CTB labeling showing the landmarks and locations of strategically placed electrolytic lesions of a, b, c, and d (marked with arrows and stars). Among these, “a” and “c” are deep microelectrode penetrations inserted into the hand region of areas S2/PV in the upper bank of lateral sulcus. C. The reconstructed somatotopic map shows responses encountered from deep penetrations recorded in areas S2/PV. Scale bar is 5 mm in the low magnification image of panel B (left), and 1 mm in all others. Abbreviation: Ipsi, ipsilateral. Other conventions follow Figure 2.

