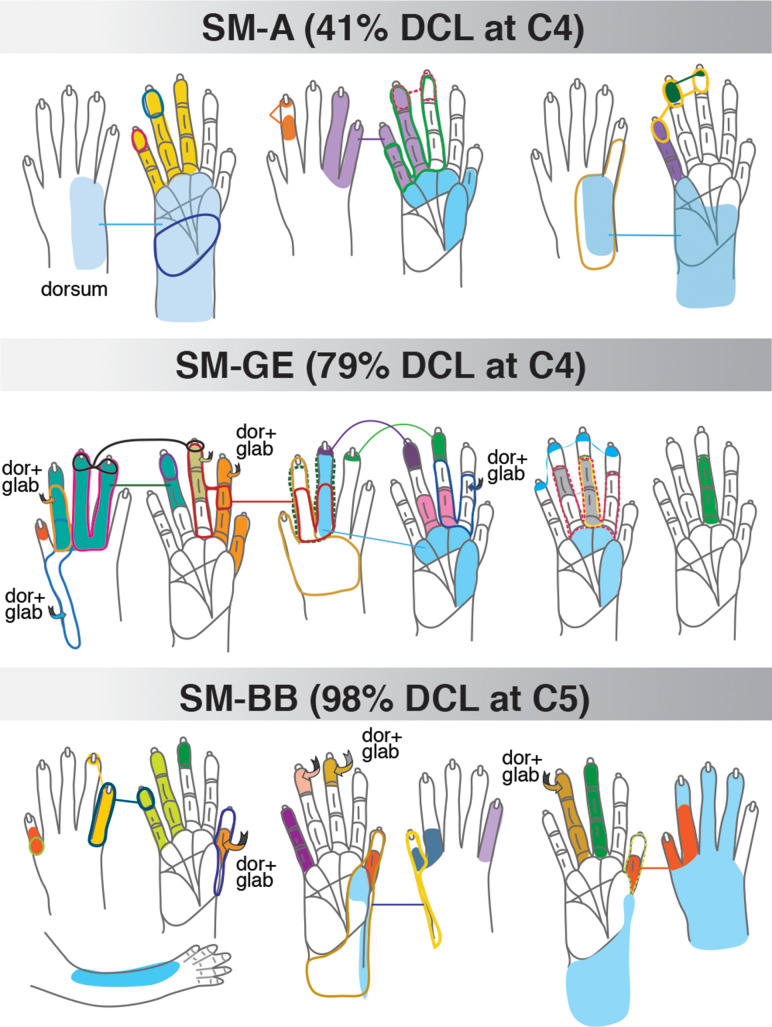
Figure 6.
Schematic drawings of representative neuronal receptive fields determined from microelectrode recordings in the hand region of areas S2/PV after electrocutaneous stimulation on alternate digits 1–3 at pre- and 2, 4, 6 weeks post-DCL. The location and size of receptive fields are color-coded and outlined on the drawings of the glabrous and dorsal surfaces of the hand and forelimb. Note that the size of receptive fields varies from one digit phalange to almost the entire hand. Other conventions follow Figure 1.

