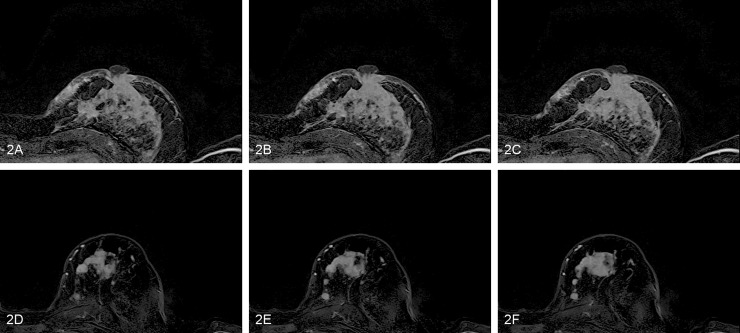
Fig 2. Example of two patients with low and high prediction scores using the model trained to predict low vs high Ki67.
(A-C) Three consecutive axial slices of a tumor lesion in the second subtraction series for the patient with the highest prediction score. Histological reference revealed a Ki67 count of 80. (D-F) The corresponding axial slices for the patient with the lowest prediction score. Histological reference revealed a Ki67 count of 10.

