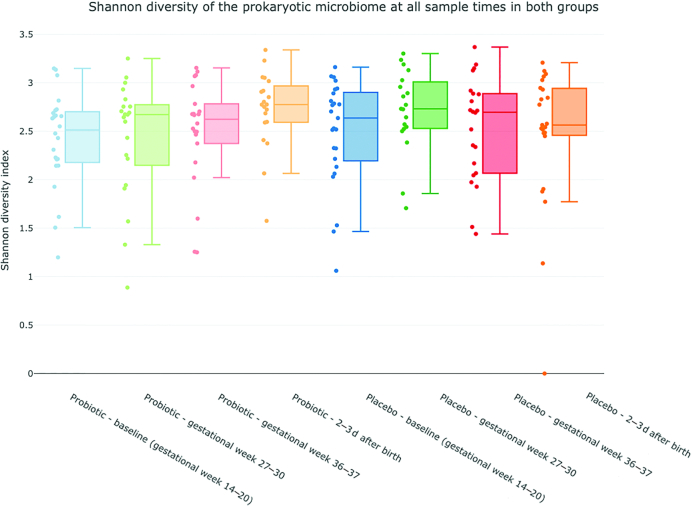
FIGURE 3.
Change in α-diversity over time in the probiotic and placebo group. Blue = baseline sample, gestational week 14–20; green = gestational week 27–30; red = gestational week 36–37; orange= 2–3 d after birth. Central line is median, box range extend to 25th and 75th percentile, whiskers extend to the value present in the data set that is furthest from the mean but within 1.5 IQR of the 25th/75th percentile.

