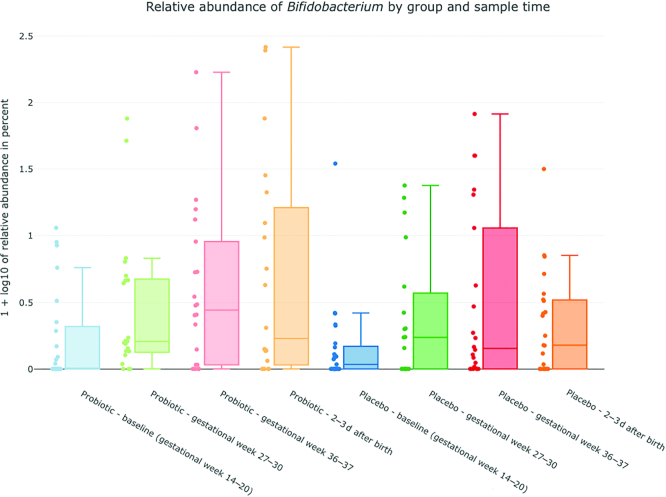
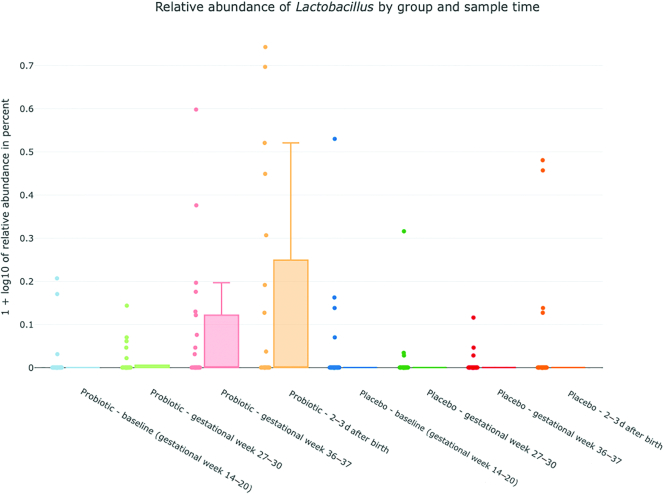
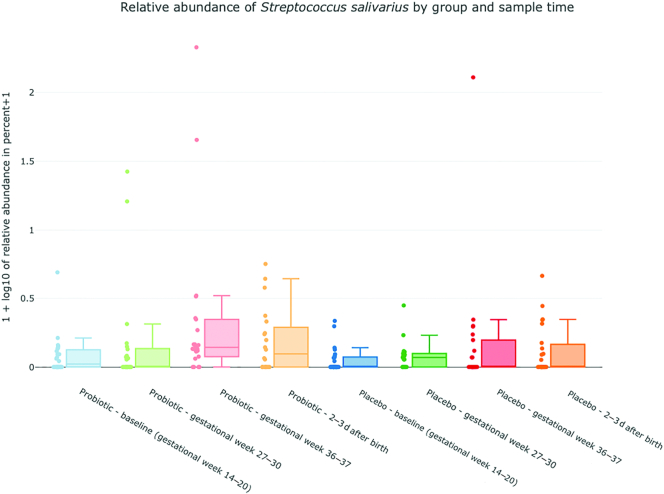
FIGURE 4.
Relative abundance of Bifidobacterium (4a), Lactobacillus (4b) and Streptococcus(4c) salivarius (y-axis) in the probiotic and placebo group. x-axis: blue = probiotic/placebo baseline, gestational week 14–20; green = probiotic/placebo gestational week 27–30; red = probiotic/placebo gestational week 36–37; blue = probiotic/placebo 2–3 d after birth. y-axis: plotted values are log10(percent abundance +1).


