
Fig. 1. AMOC strength and global mean surface air temperature in CCSM4 historical and RCP8.5 simulations and sensitivity experiment AMOC_fx.
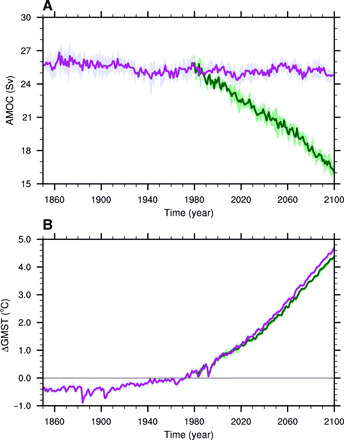
(A) From 1850 to 1980, the AMOC strength is adopted from CCSM4 historical simulation (purple, ensemble mean; light purple, ensemble spread). After 1980, the AMOC strength from CCSM4 historical and RCP8.5 simulations (AMOC_fx) is shown as green (purple) curve for ensemble mean and light green (light purple) shading for ensemble spread. The AMOC strength is defined as the maximum of the annual mean stream function below 500 m in the North Atlantic. (B) Similar to (A) but for annual and global mean surface air temperature (GMST) anomalies relative to 1961–1980.