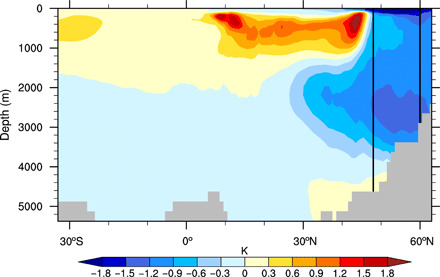
Fig. 3. AMOC impacts on Atlantic oceanic temperature projection.

Difference of zonal mean ocean temperature in the Atlantic (shading in K) during 2061–2080 between the ensemble means of CCSM4 RCP8.5 simulation and AMOC_fx (RCP8.5 minus AMOC_fx). The black lines at 48°N and 60°N denote the southern and northern borders of the water column over the NAWH region used for the heat budget analysis.
