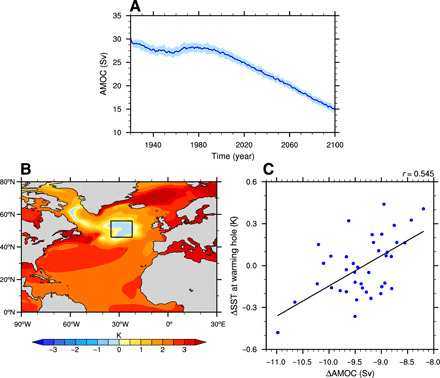
Fig. 4. The AMOC and NAWH in CESM large ensemble simulations.

(A) The AMOC strength during 1920–2100 from CESM large ensemble simulations (blue, ensemble mean; light blue, ensemble spread). The AMOC strength is defined as the maximum of the annual mean stream function below 500 m in the North Atlantic. (B) Ensemble mean SST change (years 2061–2080 minus 1961–1980) in the North Atlantic in CESM large ensemble simulations. (C) The scatter plot of SST changes over the NAWH region [46°N to 56°N and 22°W to 35°W, indicated in (B)] and AMOC strength changes in CESM large ensemble simulations (blue dots for individual members). The best-fit line (black) is calculated as the first empirical orthogonal function mode in the SST AMOC space. The correlation coefficient between SST and AMOC changes is 0.545, which is statistically significant at the 95% confidence level.
