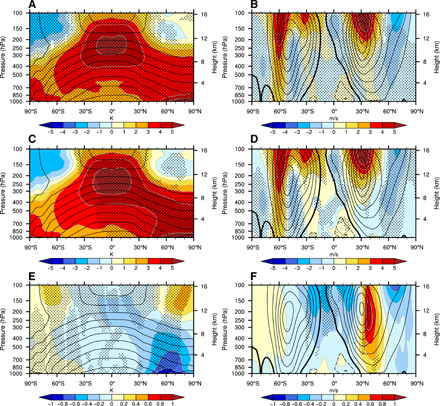
Fig. 6. Atmosphere temperature and zonal wind projections and AMOC impacts.

Left column: Relative to 1961–1980, annual and zonal mean atmosphere temperature changes (shading in K) during 2061–2080 based on the ensemble means of (A) CCSM4 RCP8.5 simulation and (C) AMOC_fx. (E) shows (A) minus (C). Contours in three panels show annual and zonal mean atmosphere temperature during 1961–1980 (contour interval of 10 K). Right column: Similar to left column but for boreal wintertime [December-January-February (DJF)] zonal mean zonal wind changes (shading in m/s). Contours in three panels show DJF zonal mean zonal winds during 1961–1980 (contour interval of 5 m/s and zero contours thickened). (F) shows (B) minus (D). In all the panels, stippling indicates that the response is statistically significant at the 95% confidence level of Student’s t test. AMOC impacts on atmosphere temperature and zonal winds are revealed in (E) and (F).
