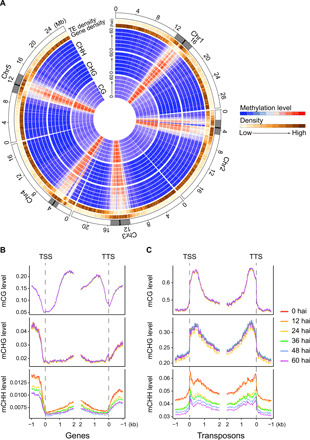
Fig. 1. Genome-wide DNA methylation dynamics during ectopic TE differentiation.

(A) Circular heatmap depicting the dynamics of DNA methylation patterns during TE differentiation. The distribution of the weighted average of CG, CHG, and CHH methylation levels per 100-kb bins on five chromosomes at six time points (0, 12, 24, 36, 48, and 60 hai) during TE differentiation is displayed. The outer annotation tracks depict the relative density of genes and transposons in the 100-kb equidistant window. (B and C) Metagene plots showing the weighted average of the CG, CHG, and CHH methylation levels of genes (B) and transposons (C) around transcription start sites (TSS) and transcription termination sites (TTS). Weighted average methylation levels for each 100-bp interval are plotted.
