
Fig. 2. Involvement of passive and active DNA demethylation in ectopic TE differentiation.
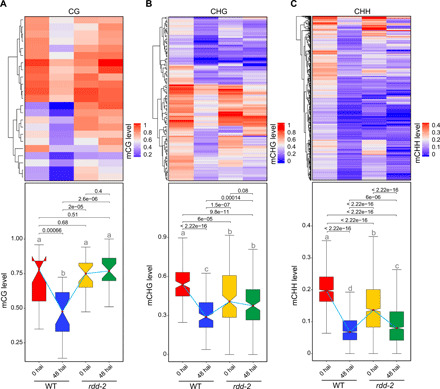
(A to C) DNA methylation levels of CG (A), CHG (B), and CHH (C) hypo-DMRs (48 hai versus 0 hai) in Col-0 and rdd-2. Upper panel: Heatmaps showing the DNA methylation levels of CG (A), CHG (B), and CHH (C) hypo-DMRs at 0 and 48 hai of ectopic TE differentiation. The y axis of the upper panel is clustered hypo-DMRs. Lower panel: Box plots showing the weighted average DNA methylation levels of different types of hypo-DMRs at 0 and 48 hai of ectopic TE differentiation. The cotyledons of Col-0 and rdd-2 seedlings were used for ectopic TE differentiation. Significant differences between two groups are marked with different letters (P < 0.001, Mann-Whitney U test).