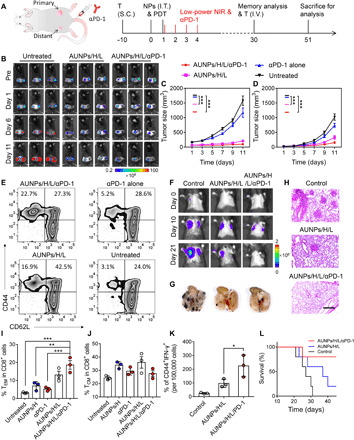
Fig. 5. Antitumor immunotherapy of AUNP synergized with αPD-1 for the establishment of systemic immune responses and long-term immune memory.

(A) Schematic illustration of synergistic treatment of bilateral B16F10 tumor mouse model (left) and the treatment schedule for immune memory analysis and tumor rechallenge (right). I.V., intravenously. (B) Bioluminescence images of bilateral B16F10 tumor–bearing mice with different treatments. (C) Primary and (D) distant tumor growth curves of the B16F10 tumor–bearing mice with different treatments (n = 5). (E) FACS plots and quantitative analysis of (I) CD8+ CD62− CD44+ effector memory T cells (TEM) and (J) CD8+ CD62+ CD44+ central memory T cells (TCM) in spleen tissue of B16F10 tumor–bearing mice after 30 days of different treatments. (F) Bioluminescence images of mice after rechallenging with intravenous injection of B16F10 tumor cells. (G) Representative lung photographs (21 days) and (H) hematoxylin and eosin (H&E) images of lung tissue slices from control (naïve mice), AUNPs/H/L, and AUNPs/H/L/αPD-1 groups. Scale bar, 100 μm. (K) Number of CD44+ IFN-γ+ per 100,000 cells of lung tissue of mice in control and treated groups. (L) Survival curve of mice in control and treated groups (n = 3). All statistical analyses were assessed using ANOVA test. Data represent means ± SEM. *P < 0.05, **P < 0.01, and ***P < 0.001. Photo credit: Duo Mao, NUS.
