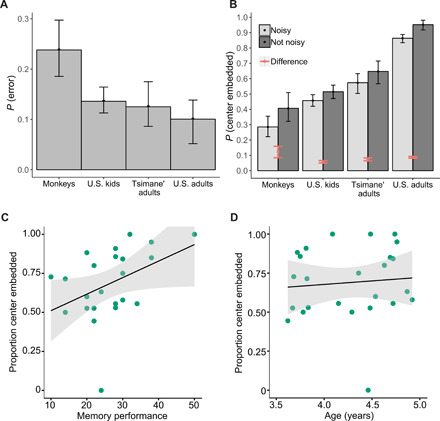
Fig. 6. The effects of noise and memory errors on generating center-embedded structures.

(A) The probability each group made an error implementing their strategy at least once in a trial, according to the results of the Bayesian analysis. (B) The probability each group generates center-embedded responses, with noise included in the model (light gray) and excluded from it (dark gray). The red bars represent the difference in center-embedding rates with and without noise for each group (i.e., the difference in the height of the bars). The error bars around the means in both (A) and (B) represent the 95% credible intervals. (C) Working memory performance, as measured by a forwards-digit task, was correlated with the proportion of center-embedded responses. (D) Age was not correlated with the proportion of center-embedded responses. The shaded regions represent 95% confidence intervals in (C) and (D).
