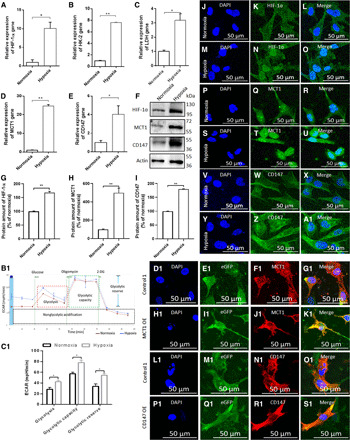
Fig. 1. Hypoxia promotes U251 GMs’ glycolytic reprogramming, including enhancing MCT1 and CD147 expression.

(A to E) Change in the mRNA expression of HIF-1ɑ, HK-2, LDH, MCT1, and CD147 in GMs in response to hypoxia (1% O2) (n = 3), as determined by quantitative real-time polymerase chain reaction (qRT-PCR). (F to I) Protein-level change of HIF-1ɑ, MCT1, and CD147 in GMs in response to hypoxia (1% O2) (n = 3), as determined by Western blot (WB). (J to Z and A1) Immunofluorescent staining for HIF-1ɑ, MCT1, and CD147 in GMs under normoxia and hypoxia. (B1) A representative graph of ECAR outputs from the XF24 analyzer for normoxic and hypoxic GMs and their response to glucose, oligomycin, and 2-deoxyglucose (2-DG) in the measurement of the status of glycolytic metabolism. (C1) Comparison of glycolysis, glycolytic capacity, and glycolytic reserve between normoxic and hypoxic GMs (n = 3). Immunofluorescent staining for MCT1 in GMs treated with (D1 to G1) empty backbone lentivirus (control 1) and (H1 to K1) MCT1 OE lentivirus for 24 hours. Immunofluorescent staining for CD147 in GMs treated with (L1 to O1) empty backbone lentivirus (control 1) and (P1 to S1) CD147 OE lentivirus for 24 hours. All data were shown as the means ± SD. Significance level: **P < 0.01, *P < 0.05, hypoxia versus normoxia.
