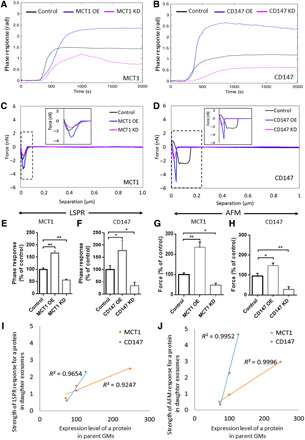
Fig. 4. Label-free quantitative detection of exosomal MCT1 and CD147 to monitor their expression levels in parent GMs, as novel surrogate biomarkers.

(A and B) Representative phase responses of the LSPR biosensor with the functionalized SAM-AuNIs sensing chip with anti-MCT1 AB or anti-CD147 AB and (C and D) separation force responses of the AFM biosensor with the functionalized silicon nitride tip with anti-MCT1 AB or anti-CD147 AB toward equal amount of daughter exosomes (50 μg/ml) from parent U251 GMs with no treatment (control), MCT1 OE, MCT1 KD, CD147 OE, and CD147 KD. (E to H) Bar graph showing the relative strength of LSPR responses (n = 3) or AFM forces (n = 12) toward exosomal MCT1 [from (A) and (C)] and CD147 [from (B) and (D)]. (I and J) Correlation curve between MCT1 or CD147 levels in parent GMs and the strength of LSPR responses toward exosomal MCT1 or CD147, respectively [for MCT1, coefficient of determination (R2) = 0.9247, and for CD147, R2 = 0.9654], or the strength of AFM forces toward exosomal MCT1 or CD147, respectively (for MCT1, R2 = 0.9996, and for CD147, R2 = 0.9952). The correlation analysis was performed based on the data obtained from (A) to (D). All data were shown as the means ± SD. Significance level: **P < 0.01, *P < 0.05, MCT1 OE and MCT1 KD group versus control. CD147 OE and CD147 KD group versus control.
