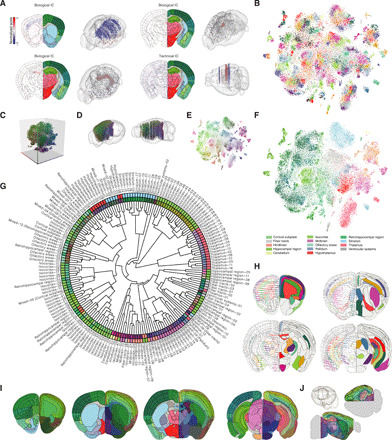
Fig. 2. Computational approaches to extract new spatial domains from the molecular atlas.

(A) Examples of ICs (biological versus technical). Left side: IC signal (normalized score). Right side: Corresponding ABA reference section. IC scores above the 95th percentile in absolute value are shown in 3D. (B) 2D t-SNE with categorical color scheme to visualize spots in 181 molecular cluster (27 unique colors). (C) 3D t-SNE to visualize molecular similarity of clusters. (D) Mapping of all spots in 3D colored by molecular similarity. (E) 2D t-SNE showing spots according to molecular similarity coloring. (F) 2D t-SNE showing spots according to ABA neuroanatomical regions. (G) Hierarchical clustering of the 181 molecular clusters (fan plot). Molecular clusters annotated with a numerical identifier and a name according to correspondence to ABA subregion. Inner layer is color-coded using molecular similarity. Outer layer colored according to ABA subregions. (H) Example coronal sections from the molecular atlas. Left side: Position and molecular identity of spots for selected clusters (black lines, ABA region borders). Right side: The same clusters shown in the molecular atlas (black lines, molecular cluster borders). (I) Example coronal sections from the molecular atlas (left side, ABA reference atlas; right side, molecular clusters color-coded on the basis of molecular similarity). (J) Virtual sectioning of the molecular atlas (black line shows example of horizontal or a sagittal plane). Molecular similarity colors based on median coordinates of spots per cluster in the 3D t-SNE shown in (C) to (E), (G), and (I).
