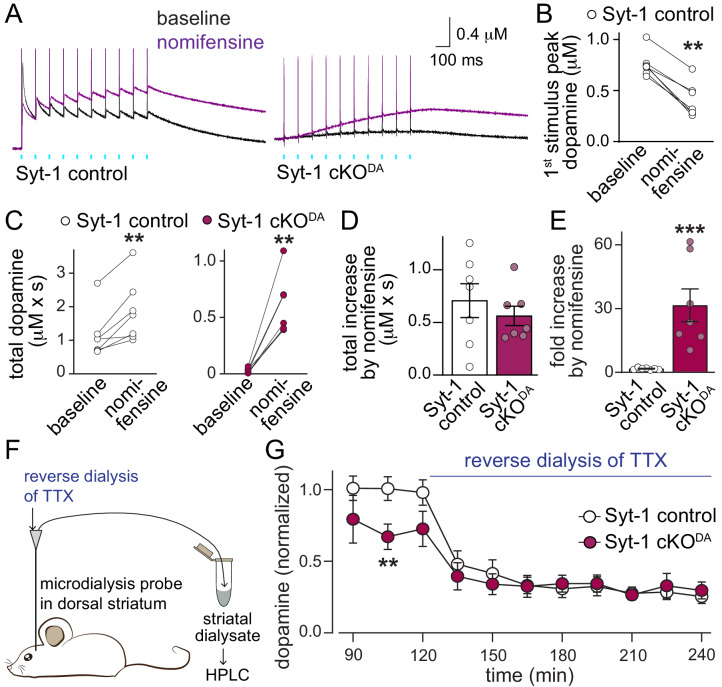
Figure 3. Asynchronous dopamine release sustains extracellular dopamine in vivo after ablation of Synaptotagmin-1.
(A–E) Sample traces (A, average of four sweeps) and quantification of dopamine release (B–E) evoked by a 10 Hz stimulus train induced as described in Figure 1H before (black traces) and after addition of the DAT blocker nomifensine (10 µM, purple traces) in Syt-1 control and Syt-1 cKODA slices. Amplitudes of the first response (B, Syt-1 control only), total dopamine (area under the curve for 2.935 s after the 1st stimulus) before and after nomifensine (C), subtracted area (D) and fold increase after nomifensine (E) are shown, Syt-1 control n = 7 slices/5 mice, Syt-1 cKODA n = 7/5. (F, G) Schematic of the experiment (F) and summary plot (G) of in vivo dopamine measurements using microdialysis in the dorsal striatum (microdialysates were collected over periods of 15 min and values measured in these microdialysates at the end of each period are plotted) of Syt-1 control and Syt-1 cKODA mice. The quantification in G shows dopamine levels normalized to the average concentration from the 76th - 120th min in Syt-1 control, and reverse dialysis of 10 µM TTX to block action potential firing started at 121 min, Syt-1 control n = 5 mice, Syt-1 cKODA n = 5 mice. All data are shown as mean ± SEM, **p<0.01, ***p<0.001, statistical significance was determined by Wilcoxon matched pairs signed rank tests in B and C, Mann Whitney tests in D and E, and by two-way ANOVA followed by Sidak’s multiple comparisons test in G. In G, the data followed a lognormal distribution and statistical testing was done after the data were converted to a loge scale, *** for time and ** for interaction, post-tests for genotypes are shown.

