. 2020 Jun 26;9:e56945. doi: 10.7554/eLife.56945

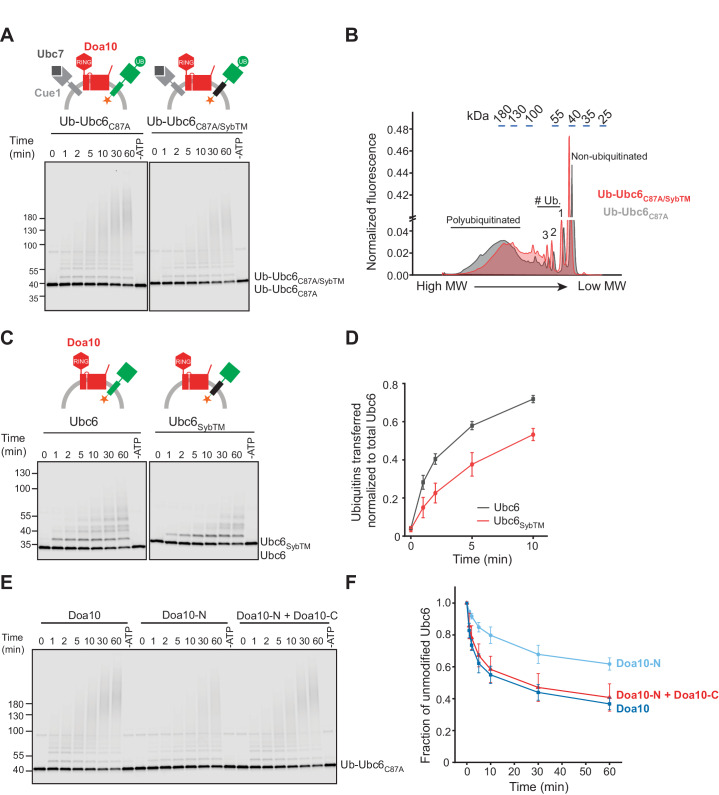
Figure 5. Structural Determinants for Ubiquitination.

(A) Time course of ubiquitination of Ub-Ubc6C87A or Ub-Ubc6C87A/SybTM by Doa10 in the presence of Cue1/Ubc7. For each reaction, a 60 min sample in the absence of ATP is shown. Samples were analyzed by SDS-PAGE and fluorescence scanning. Final concentrations: 40 nM Doa10, 10 nM Cue1, 1 µM Ubc7, 100 nM Ubc6 variants, 100 nM E1, 120 µM ubiquitin, and 2.5 mM ATP. See Figure 5—figure supplement 1A for quantification of unmodified Ubc6 variants. (B) Comparison of ubiquitin-chain length on Ub-Ubc6C87A or Ub-Ubc6C87A/SybTM. Line-scans were performed on fluorescence images of two representative gel samples (30 min timepoint) as in (A). Approximate molecular weights are indicated on top. # Ub., number of ubiquitin moieties attached. (C) Time-course of Ubc6 WT or Ubc6SybTM ubiquitination in the absence of Ubc7/Cue1. Analysis and concentrations as in (A). See Figure 5—figure supplement 1C for quantification of unmodified Ubc6 variants. (D) Quantification (mean ± SD) of total ubiquitin-transfer to Ubc6 or Ubc6SybTM from three experiments as in (C). Intensities of Ubc6 variants with one to four ubiquitin moieties attached were determined as described in Figure 5—figure supplement 1D, summed up for each time point and normalized to total Ubc6 in the reaction. (E) Time course of ubiquitination of Ub-Ubc6C87A by Doa10 variants in the presence of Cue1/Ubc7. Liposomes contained Ub-Ubc6C87A and either full-length Doa10, only Doa10-N, or both Doa10-N and -C. Analysis and concentrations as in (A). (F) Quantification (mean ± SD) of unmodified Ub-Ubc6C87A from three experiments as in (E).

Figure 5—source data 1. This file contains the quantification of the number of ubiquitins (n) transferred per Ubc6 or Ubc6SybTM (Figure 5—figure supplement 1D) as well as the quantification of the number of total ubiquitin transferred from three experiments as in Figure 5C, as shown in Figure 5D.
Figure 5—source data 2. This file contains the quantification of the fraction of unmodified Ubc6 from three experiments as in Figure 5E, as shown in Figure 5F.

Figure 5.

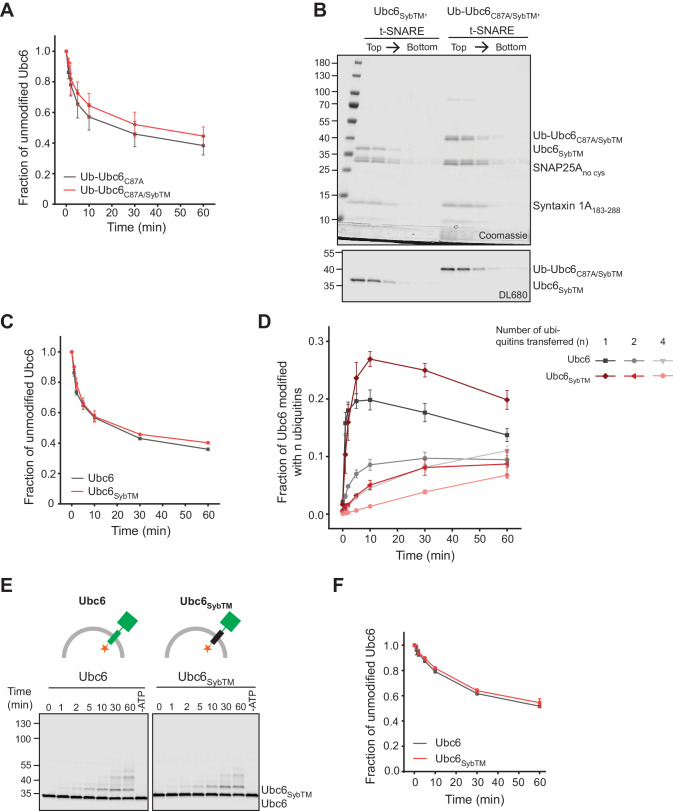
Figure 5—figure supplement 1. Ubiquitination of Ubc6/Syb chimera.

Figure 5—figure supplement 1.

(A) Quantification (mean ± SD) of the fraction of unmodified Ub-Ubc6C87A or Ub-Ubc6C87A/SybTM from three experiments as in Figure 5A. (B) Liposomes with t-SNARE co-reconstituted with either Ubc6SybTM or Ub-Ubc6C87A/SybTM (fluorescently labeled) were subjected to a Nycodenz step gradient. After ultracentrifugation, the gradient was fractionated and analyzed by SDS-PAGE and Coomassie Blue staining (top) and fluorescence scanning (bottom). (C) Quantification (mean ± SD) of the fraction of unmodified Ubc6 or Ubc6SybTM from three experiments as in Figure 5C. (D) Quantification (mean ± SD) of mono-, di-, and tetra-ubiquitinated Ubc6 species relative to total Ubc6 from three experiments as in Figure 5C. (E) Time course of E3-independent autoubiquitination of Ubc6 and Ubc6SybTM. Liposomes containing the indicated Ubc6 variants (100 nM) were incubated with 100 nM E1, 120 µM ubiquitin, and 2.5 mM ATP. A 60 min sample in the absence of ATP is shown for each reaction. Samples were analyzed by SDS-PAGE and fluorescence scanning. (F) Quantification (mean ± SD) of the fraction of unmodified Ubc6 or Ubc6SybTM from three experiments as in (E).
Figure 5—figure supplement 1—source data 1. This file contains the quantification of the fraction of unmodified Ubc6 as shown in Figure 5—figure supplement 1A, C and F.

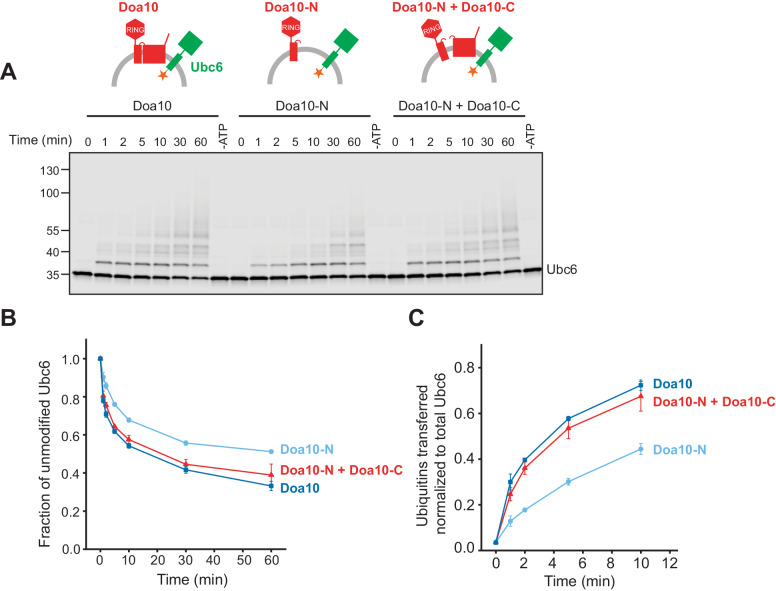
Figure 5—figure supplement 2. Ubc6 ubiquitination by Doa10 variants.

Figure 5—figure supplement 2.

(A) Time course of Ubc6 ubiquitination in the presence of different Doa10 variants in the absence of Ubc7/Cue1. Indicated liposomes were incubated with 100 nM E1, 120 µM ubiquitin, and 2.5 mM ATP (f.c. 100 nM Ubc6, 10 nM Cue1, and 40 nM for Doa10-variants). A 60 min sample in the absence of ATP is shown for each reaction. Samples were analyzed by SDS-PAGE and fluorescence scanning. (B) Quantification (mean ± SD) of the fraction of unmodified Ubc6 from three experiments as in (A). (C) Quantification (mean ± SD) of total ubiquitin-transfer relative to Ubc6 from three experiments as in (A). Intensities of Ubc6 with one to four ubiquitin moieties attached were summed up for each time point and normalized to total Ubc6 in the reaction, as described in Figure 5D and Figure 5—figure supplement 1D.
Figure 5—figure supplement 2—source data 1. This file contains the quantification of the fraction of unmodified Ubc6 as shown in Figure 5—figure supplement 2B.
Figure 5—figure supplement 2—source data 2. This file contains the quantification of the number of total ubiquitin transferred in presence of different Doa10 variants from three experiments, as shown in Figure 5—figure supplement 2C.