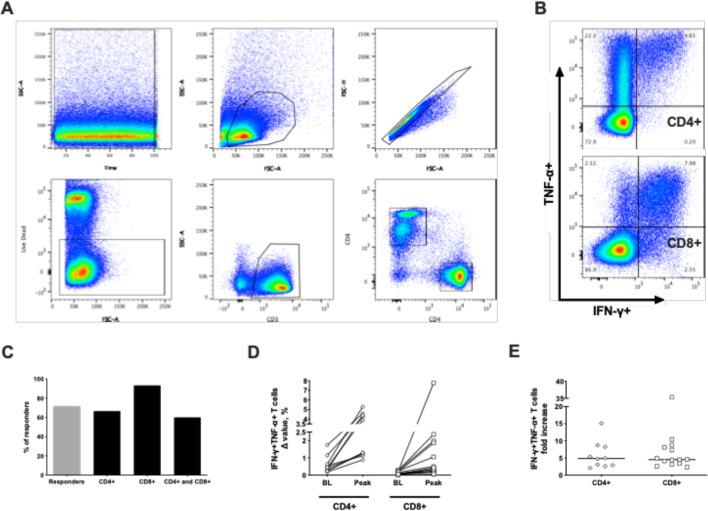
Figure 4.
Flow cytometry analysis of 5T4-specific immune responses induced by vaccination. Freshly isolated peripheral blood mononuclear cells (PBMCs) were cultured for 2 weeks in the presence of low-dose hIL-2 and the total 5T4 peptide pool to expand relatively infrequent 5T4-specific T cells. Flow cytometric analysis was performed on cultured cells at different time points, and the percentage of polyfunctional CD4+ and CD8+ secreting IFN-γ+ and TNF-α+ was calculated by subtracting background responses (Δ value) and compared with corresponding pre-vaccination values. (A) Representative gating strategy. From left to right, top to bottom: time–lymphocytes–single cells–live cells–CD3+ T cells–CD4+ and CD8+ T cells. (B) Representative dot plot with percentages showing CD4+ (top) and CD8+ (bottom) T cells secreting IFN-γ+ and TNF-α+. (C) Percentages of evaluated patients showing a positive response in cultured PBMCs (gray bar) and relative percentages of positivity for CD4+, CD8+, and both CD4+ and CD8+ among responders (black bars). (D) Baseline Δ value percentages of IFN-γ+ and TNF-α+CD4+ and CD8+ T cells are compared with corresponding peak Δ value percentages obtained after vaccination in each individual patient analyzed. BL: baseline. (E) Fold increase of peak Δ value percentages over baseline of polyfunctional CD4+ and CD8+ T cells induced by vaccination are shown. Lines represent median.

