Figure 1.
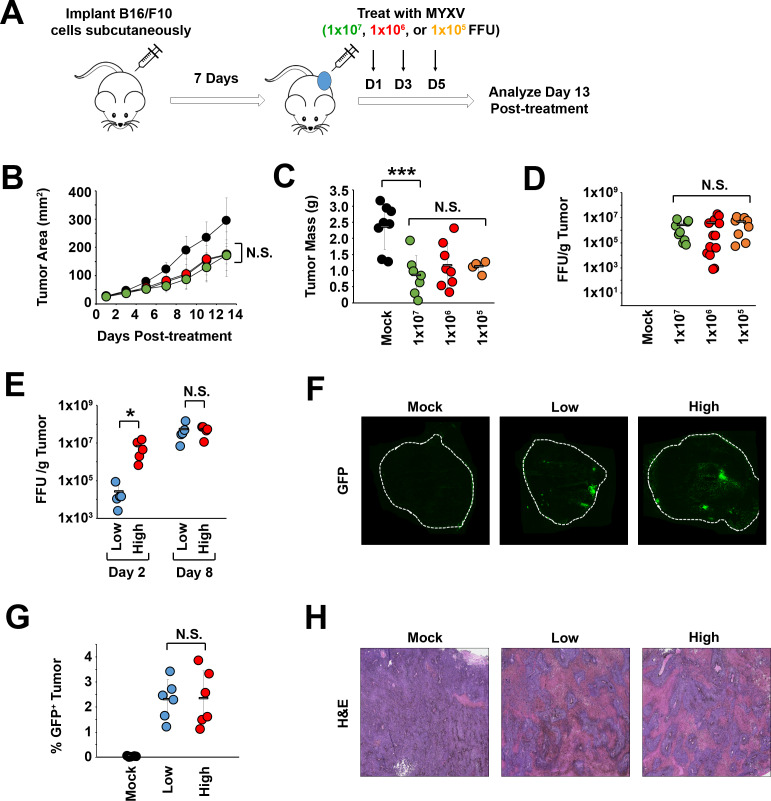
Total load of oncolytic virus normalizes in vivo independent of initial dose. (A) Schematic diagram of experimental design. C57/B6 mice were injected subcutaneously with B16/F10 cells. Once tumors reached ~25 mm2, animals were either mock treated (n=8) or treated with three intratumorous injections of either 1×10⁷ (n=7), 1×10⁶ (n=8), or 1×10⁵ (n=8) foci forming units (FFU) of myxoma virus (MYXV). (B) Average tumor area (mm2) for each treatment over time. (C) Total tumor mass on day 13. (D) Quantitation of infectious virus in each tumor. Data are normalized to tumor mass and displayed as FFU/gram tissue. (E–H) Tumors were established in mice as above and treated with either a high dose (1×10⁶ FFU, n=6) or a low dose (1×10⁴ FFU, n=6) of MYXV. (E) Quantitation of infectious virus in each tumor either 2 days or 8 days after treatment. Data are normalized to tumor mass and displayed as FFU/gram tissue. (F) Visual depiction of GFP+ viral foci in snap-frozen tumor sections. (G) Quantitation of the number of GFP+ tumor cells presents in each tumor at Day 8. (H) Representative images of H&E-stained tumor sections from each treatment group. Viable tumor is visualized as purple regions while necrotic tumor is visualized as pink. Statistical significance was determined using unpaired Student’s t-test (N.S., *p<0.05, ***p<0.001). N.S., not significant.

