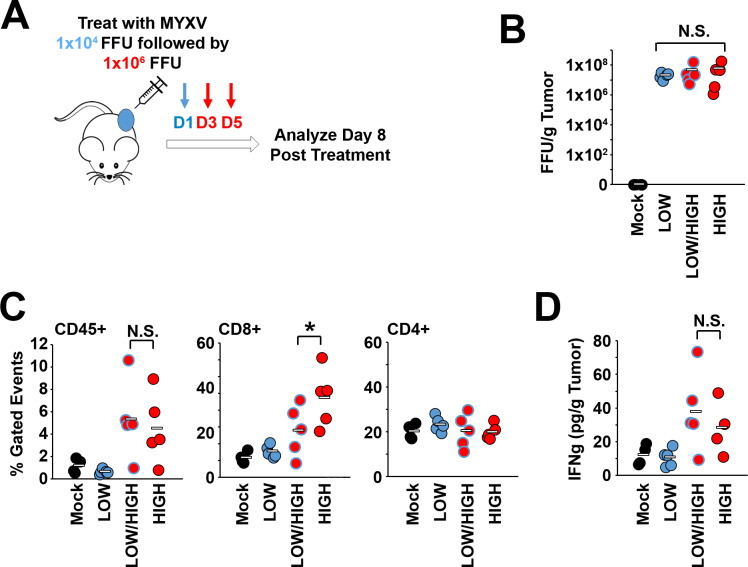
Figure 4.
Treatment with low doses of oncolytic virus does not prevent immunological improvement on secondary treatment with high doses. (A) Schematic diagram of experimental design. C57/B6 mice were injected subcutaneously with B16/F10 cells. Once tumors reached ~25 mm2, animals were either mock treated, treated with three intratumorous injections of either a high dose (1×10⁶ foci forming units (FFU)) or low dose (1×10⁴ FFU) of myxoma virus (MYXV) or treated with a single low dose of virus followed by two secondary treatments with high dose (LOW/HIGH) (n=5/group). Tumors were harvested 8 days after initiation of treatment for analysis. (B) Quantitation of infectious virus in each tumor. Data are normalized to tumor mass and displayed as FFU/gram tissue. (C) Abundance of total CD45+ cells, CD8+ T cells or CD4+ T cells within tumors treated as indicated measured by flow cytometry. (D) Abundance of the T-cell effector molecule interferon-γ within tumors treated as indicated measured by ELISA. Statistical significance was determined using unpaired Student’s t-test (*p<0.05, N.S.). IFNg, interferon gamma; N.S., not significant.

