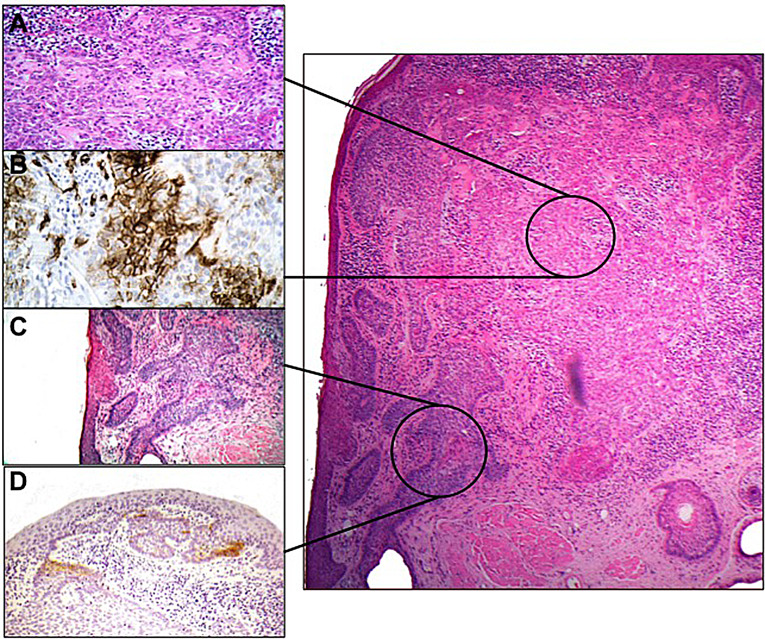
Figure 3.
Image on the right displays H&E-stained section showing DT indicated by the top black circle and BCC indicated by the lower black circle. (A) H&E. Higher power of DT, showing strands of tumour cells surrounded by pink basement membrane-like material. (B) CD34 immunohistochemistry staining showing positivity in DT (brown colour=positive staining). (C) H&E of higher power of BCC. (D) BerEP4 immunohistochemistry staining showing focal positivity of BCC (brown colour=positive staining) (Images adapted from Ung et al15).

