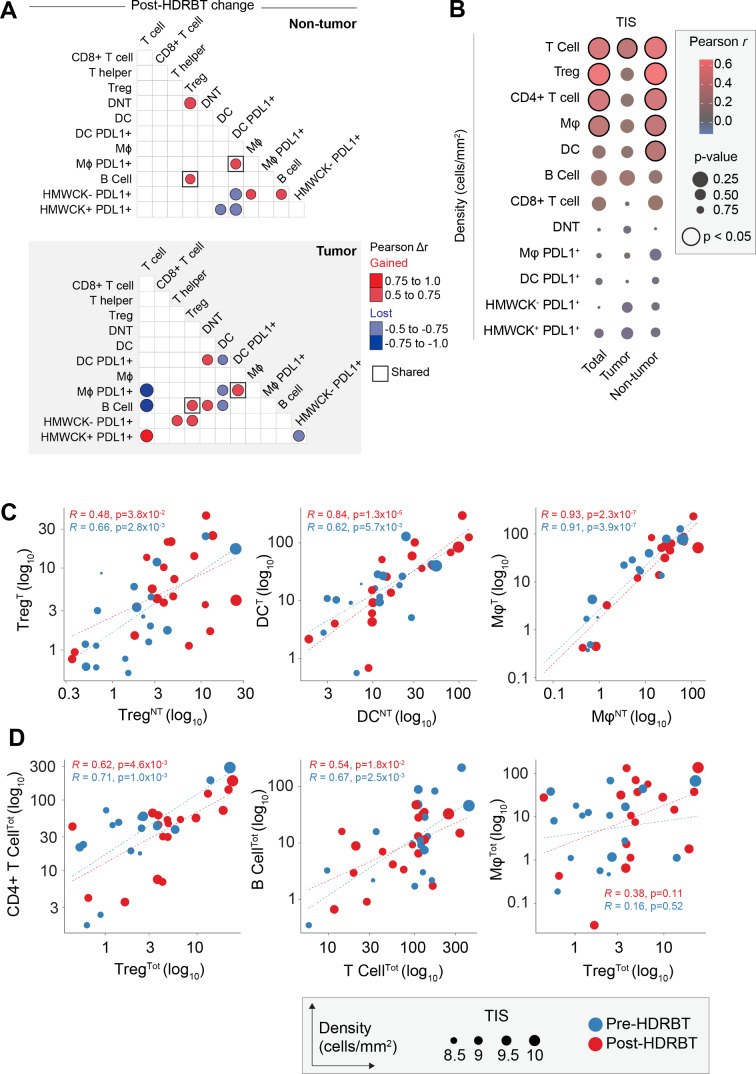
Figure 5.
Immune cell density relationships correlate with TIS signature. (A) Computed differences in Pearson correlation (Δr) for either (i) nontumor and (ii) tumor following HDRBT. Color indicates direction of change, that is, red=gained association, blue=lost association. Only significant associations are shown. (B) Bubblechart of correlation (Pearson r) between immune cell densities in different tissue zones (total, tumor, or nontumor) and TIS signature. Significant correlations indicated. (C) Scatterplots of highly significant immune cell subset correlations between tumor and nontumor tissue zones, and (D) highly significant cross-subset correlations in total tissue, with relative TIS level and HDRBT radiation-status indicated. (T: tumor zone, NT: nontumor zone, Tot: all tissue zones). Pearson correlation r values and corresponding p values indicated. HDRBT, high dose-rate brachytherapy; TIS, tumor inflammatory signature.

