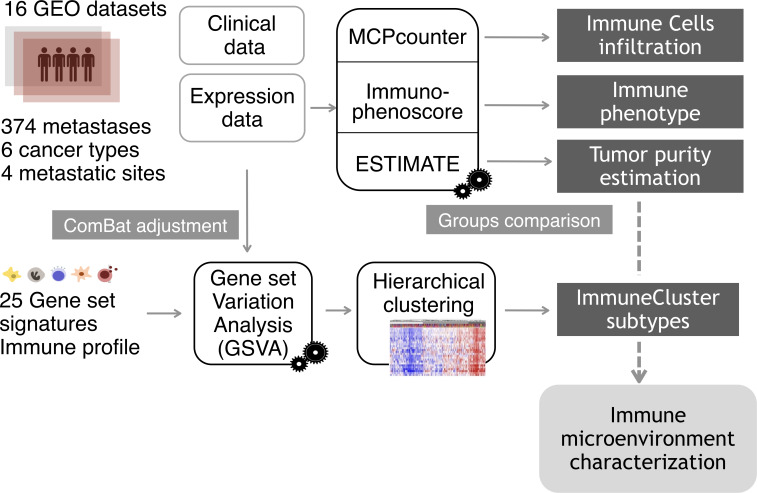
Figure 1.
Analysis overview. Gene expression data from a cohort of 374 samples from four different metastatic locations were collected from Gene Expression Omnibus (GEO) database. To eliminate the batch effect, data were adjusted using the ComBat function. For each metastatic sample, tumor purity, proportion of immune cell infiltration and immune status were estimated using the R packages ESTIMATE (Estimation of STromal and Immune cells in MAlignant Tumor tissues using Expression data), MCPcounter (Microenvironment Cell Populations-counter) and the Immunophenoscore algorithm. Applying Gene Set Variation Analysis (GSVA) function, samples were scored according to the level of expression of a comprehensive set of gene signatures related to immune response. The resulting scores were used to cluster the metastatic samples on the basis of their immune profile.

