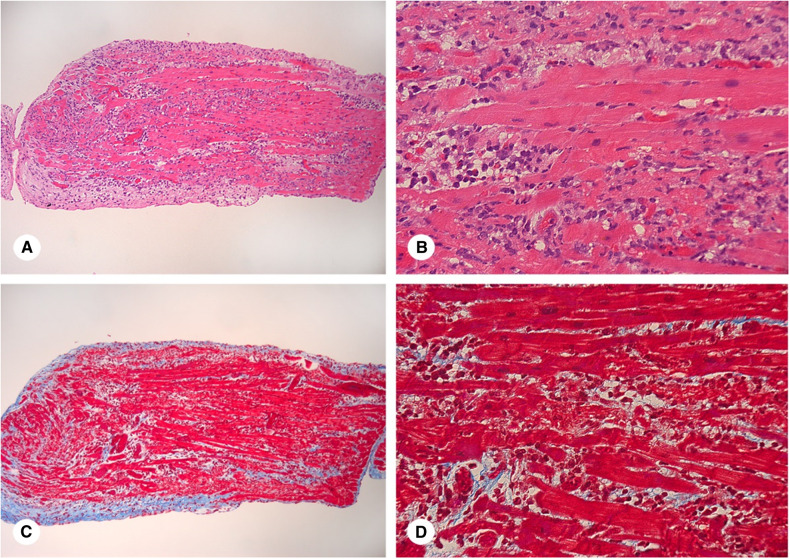
Figure 4.
Endomyocardial biopsy: A and C. Light micrograph of a biopsy sample of myocardium. The endocardium surrounds the entire biopsy piece (blue fibrous tissue in C). The normal endocardium is seen in the right lower corner of the piece. The remainder of the endocardium is much thicker and shows mononuclear cells as well as spindle shaped cells (fibroblasts) indicating a repair process. The myocardium shows abundant inflammatory infiltrate as well as areas of interstitial fibrosis (blue stain in C). (A. Haematoxylin and eosin stain. X100, C. Trichrome stain. X100). B and D. Higher magnification shows the inflammatory infiltrates (predominantly lymphocytes and macrophages with a minor component of neutrophils and eosinophils) which encroach and separate the myocyte bundles. The interstitial fibrosis is more subtle but present (blue in D), indicating a repair process ongoing concomitantly with the inflammatory process. (B. Haematoxylin and eosin stain. X500, D. Trichrome stain. X500).

